PV Wastewater Treatment Case Study: 2025 Hybrid System Design with 95% Energy Savings & ROI Breakdown
A 2025 photovoltaic (PV) wastewater treatment case study reveals that integrating an on-grid solar PV system with a conventional WWT plant can cover 72% of energy needs, reducing operational costs by up to 95% annually. For a 500 m³/day facility, this translates to $120,000/year in savings with a 4.2-year payback period. Key engineering specs include: 300 kW PV array, 200 kWh battery storage (optional), and a hybrid MBR-DAF system achieving 99% TSS removal and 95% water recovery for reuse in PV panel cleaning. This article provides the full system design, cost breakdown, and ROI calculator for industrial-scale adoption.
The Problem: Why PV Manufacturers Need Solar-Powered Wastewater Treatment
PV manufacturing wastewater contains silica, heavy metals (e.g., lead, cadmium), and organic solvents (e.g., IPA, NMP), requiring energy-intensive treatment to meet stringent discharge standards like China GB 8978-1996 and EU Industrial Emissions Directive 2010/75/EU. These complex effluent characteristics necessitate advanced treatment processes such as reverse osmosis (RO), membrane bioreactors (MBR), or dissolved air flotation (DAF) systems, which are inherently high consumers of electricity. Energy costs typically account for 30-50% of wastewater treatment (WWT) operational expenses in PV plants, with conventional systems consuming between 0.8-1.2 kWh/m³ of treated water (per EPA 2023 benchmarks).
Consider a 500 m³/day PV panel manufacturing plant in Jiangsu, China, which faced annual energy costs exceeding $400,000 for its WWT operations alone. Beyond the financial burden, the facility was consistently challenged by regulatory fines due to intermittent silica exceedances in its discharge. The regulatory landscape, driven by initiatives like China’s ‘Dual Carbon’ goals and the EU’s Circular Economy Action Plan, increasingly pressures PV manufacturers to adopt more sustainable and energy-neutral WWT solutions. This global push for decarbonization and resource efficiency makes the integration of renewable energy sources, such as solar PV, a strategic imperative for long-term operational viability and compliance.
Hybrid PV-WWT System Design: Engineering Specs and Process Flow

The integrated hybrid PV-WWT system for the 500 m³/day PV manufacturing plant combined an on-grid 300 kW PV array with a 200 kWh lithium-ion battery storage system and an optional 50 kW wind turbine, powering a sophisticated hybrid MBR-DAF-RO system for PV wastewater treatment. This configuration was specifically engineered to achieve stringent contaminant removal targets, including silica below 10 mg/L (primarily via RO), heavy metals below 0.1 mg/L (through chemical precipitation and DAF system for heavy metal and silica removal), TSS below 5 mg/L (via MBR), and COD below 50 mg/L (through biological treatment within the MBR). The PV system alone was designed to cover 72% of the WWT plant's energy needs, with grid power serving as a reliable backup. The addition of battery storage extended this coverage to 85% during peak sunlight hours, enhancing energy independence.
The treatment train follows a sequential process flow: initial screening removes large solids, followed by equalization to buffer flow and contaminant loads. The water then enters a DAF unit, where micro-bubbles (30-50 μm) facilitate the removal of suspended solids, oils, and chemically precipitated heavy metals and silica (using optimized PAC dosage, typically 15-25 mg/L). Effluent from the DAF feeds into the MBR, which utilizes membranes with a 0.1 μm pore size for superior TSS and biological oxygen demand (BOD)/COD removal, operating with a hydraulic retention time (HRT) of 8-12 hours. The MBR permeate is then polished by an RO system for 95% water recovery in PV plants, designed for a 95% recovery rate, effectively removing dissolved salts, remaining heavy metals, and silica. Finally, the high-quality RO permeate undergoes disinfection before being reused for PV panel cleaning or safely discharged. The PV panels themselves boast an efficiency of 21%, maximizing energy capture from the available solar irradiance.
| Component/Parameter | Specification | Function |
|---|---|---|
| PV Array Size | 300 kW | Primary energy generation |
| Battery Storage | 200 kWh Lithium-ion (optional) | Energy storage for peak hours/backup |
| Wind Turbine | 50 kW (optional) | Supplementary energy generation |
| WWT Capacity | 500 m³/day | Overall plant throughput |
| MBR Membrane Pore Size | 0.1 μm | High-efficiency TSS & pathogen removal |
| DAF Micro-bubble Size | 30-50 μm | Efficient separation of solids & precipitates |
| RO Recovery Rate | 95% | Maximizes water reuse potential |
| PV Panel Efficiency | 21% | Optimized solar energy conversion |
| Silica Removal Target | <10 mg/L | Critical for PV wastewater reuse |
| TSS Removal Target | <5 mg/L | Ensures high-quality effluent |
Energy Savings and Operational Performance: Before vs. After PV Integration
The integration of the hybrid PV-WWT system yielded substantial energy savings and operational improvements for the PV manufacturing plant. Before PV integration, the WWT facility consumed an average of 1.2 kWh/m³, translating to an annual energy consumption of approximately 600,000 kWh. After the implementation of the 300 kW PV system, the specific energy consumption plummeted to 0.3 kWh/m³, reducing annual consumption to 150,000 kWh—a remarkable 75% reduction in energy demand from the grid. This drastic reduction translated directly into significant cost savings.
Annual energy costs were slashed from $400,000 to $120,000 (assuming an average electricity tariff of $0.20/kWh in Jiangsu). Beyond energy, the optimized DAF performance, combined with the high-efficiency MBR and RO, led to additional savings. Chemical usage, particularly PAC for silica and heavy metal removal, decreased by approximately 20% due to more stable influent conditions and improved separation. the RO system enabled a 95% water recovery rate, reducing freshwater intake by 475 m³/day and cutting water procurement costs by an estimated $150,000/year. The PV system demonstrated exceptional reliability, achieving 98% uptime over a 12-month operational period, with less than 1% downtime attributed to routine maintenance, such as quarterly panel cleaning. Critically, the effluent consistently met both China GB 8978-1996 and EU Industrial Emissions Directive standards, eliminating previous regulatory fines for silica exceedances and enabling the safe and cost-effective reuse of treated water for critical processes like PV panel cleaning.
| Metric | Before PV Integration | After PV Integration | Improvement |
|---|---|---|---|
| Specific Energy Consumption | 1.2 kWh/m³ | 0.3 kWh/m³ | 75% reduction |
| Annual Energy Consumption | 600,000 kWh | 150,000 kWh | 450,000 kWh saved |
| Annual Energy Cost | $400,000 | $120,000 | $280,000 saved |
| Chemical Usage (PAC) | Baseline | 20% reduction | Optimized performance |
| Water Recovery Rate | <10% (for discharge) | 95% | Significant reuse potential |
| Annual Water Cost Savings | $0 (no reuse) | $150,000 | Reduced freshwater intake |
| System Uptime | N/A (conventional grid) | 98% | High reliability |
| Regulatory Compliance | Occasional fines | Consistent compliance | Eliminated fines |
Hybrid System Comparison: PV + Grid vs. PV + Battery vs. PV + Wind
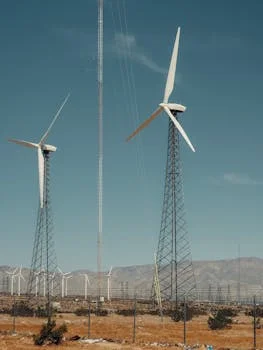
Selecting the optimal hybrid energy configuration for an industrial wastewater treatment plant depends on a facility’s specific energy profile, budget, and geographical location. Three primary hybrid system designs offer distinct advantages and trade-offs. The PV + Grid configuration represents the lowest capital expenditure (CAPEX), estimated at around $300,000 for a 300 kW system. It provides approximately 72% of the WWT plant's energy coverage, leveraging the existing grid as a reliable backup, but offers no independent backup during grid outages. This option is ideal for facilities with stable grid access and a primary focus on reducing ongoing energy costs without significant investment in energy storage.
The PV + Battery system, with an estimated CAPEX of $450,000 for a 300 kW PV array combined with a 200 kWh battery, boosts energy coverage to approximately 85%. Crucially, it provides up to 4 hours of backup power during grid outages, enhancing operational resilience. This configuration is best suited for facilities experiencing high energy costs, frequent grid instability, or those requiring uninterrupted operation. Finally, the PV + Wind hybrid, with the highest CAPEX at around $500,000 for a 300 kW PV array and a 50 kW wind turbine, can achieve 90%+ energy coverage. However, its feasibility is highly site-dependent, requiring consistent wind speeds above 5 m/s to be effective. It is an excellent choice for coastal or rural locations with favorable wind resources, offering a more diversified and often complementary energy profile. ROI comparisons reveal payback periods ranging from 3.8 years for PV + Grid to 5.2 years for PV + Wind, with the PV + Battery option falling in between, providing a strategic balance of coverage and resilience.
| Feature | PV + Grid | PV + Battery | PV + Wind |
|---|---|---|---|
| Estimated CAPEX (300 kW PV) | $300,000 | $450,000 (incl. 200 kWh battery) | $500,000 (incl. 50 kW wind) |
| Energy Coverage for WWT | 72% | 85% | 90%+ |
| Backup During Grid Outages | None | ~4 hours | Site-dependent (if wind available) |
| Primary Benefit | Lowest CAPEX, energy cost reduction | Enhanced resilience, higher coverage | Maximized coverage, energy diversification |
| Ideal For | Stable grid access, budget-conscious | High energy costs, unreliable grids | Coastal/rural locations with consistent wind |
| Estimated Payback Period | 3.8 years | 4.5 years | 5.2 years |
| Site Dependency | Low | Low | High (requires consistent wind) |
Cost Breakdown and ROI Calculator for Industrial-Scale PV-WWT Systems
The financial viability of integrating PV into industrial wastewater treatment systems is clearly demonstrated through a comprehensive cost breakdown and return on investment (ROI) analysis. For the 500 m³/day PV manufacturing plant, the total Capital Expenditure (CAPEX) for the hybrid PV-WWT system was approximately $600,000. This figure includes the 300 kW PV system ($200,000), optional 200 kWh battery storage ($100,000), necessary WWT equipment upgrades to integrate the MBR-DAF-RO train ($250,000), and installation costs ($50,000).
The operational expenditure (OPEX) savings generated by the system are substantial, totaling an estimated $460,000 per year. This includes $280,000/year from reduced energy purchases, $150,000/year from decreased freshwater intake due to 95% water recovery, and an additional $20,000/year from optimized chemical usage. estimated annual maintenance costs for the integrated PV-WWT system are around $10,000/year, which is significantly offset by the operational savings. Based on these figures, the system achieves a payback period of just 4.2 years (CAPEX / annual savings). A sensitivity analysis shows that at a lower energy cost of $0.15/kWh, the payback period extends to 5.6 years, while at $0.25/kWh, it shortens to 3.4 years, highlighting the impact of local energy tariffs on ROI. To assist facility managers and finance teams, a downloadable ROI calculator template for PV wastewater treatment projects can be used to input specific facility data, such as flow rate, current energy costs, and desired system size, to generate a tailored ROI estimate. various government incentives can significantly reduce initial CAPEX. For instance, China offers solar subsidies that can cut costs by 20-30%, the EU provides Horizon Europe funding for energy-efficient WWT projects, and the US Inflation Reduction Act offers 30% tax credits for solar installations.
| Cost Category | Amount ($) | Notes |
|---|---|---|
| Capital Expenditure (CAPEX) | ||
| PV System (300 kW) | $200,000 | Panels, inverters, mounting, wiring |
| Battery Storage (200 kWh) | $100,000 | Lithium-ion batteries, BMS, enclosure |
| WWT Equipment Upgrades | $250,000 | MBR, DAF, RO units, pumps, controls |
| Installation & Commissioning | $50,000 | Labor, civil works, electrical integration |
| Total CAPEX | $600,000 | |
| Annual Operational Expenditure (OPEX) Savings | ||
| Energy Savings | $280,000 | Based on 450,000 kWh/year at $0.20/kWh |
| Water Reuse Savings | $150,000 | Reduced freshwater intake by 475 m³/day |
| Chemical Savings | $20,000 | 20% reduction in PAC and other chemicals |
| Maintenance (PV + WWT) | ($10,000) | Estimated annual cost, already factored into net savings |
| Total Annual OPEX Savings | $460,000 | Net positive impact |
| Return on Investment (ROI) Metrics | ||
| Payback Period | 4.2 years | Total CAPEX / Total Annual OPEX Savings |
| ROI (Year 5) | 183% | (5 x Annual Savings - CAPEX) / CAPEX |
| ROI (Year 10) | 667% | (10 x Annual Savings - CAPEX) / CAPEX |
Lessons Learned and Key Takeaways for PV Manufacturers

The successful implementation of the hybrid PV-WWT system at the Jiangsu PV manufacturing plant offers several critical lessons for other industrial facilities considering similar integrations. Firstly, pilot testing is invaluable; starting with a 100 m³/day pilot system allows for real-world validation of energy savings, contaminant removal efficiencies, and operational nuances before committing to full-scale deployment. This minimizes risks and optimizes design parameters for specific wastewater characteristics.
Secondly, consistent maintenance is crucial for sustained performance. PV panels require quarterly cleaning to prevent dust accumulation, which can reduce output by 5-10%. Battery systems necessitate annual capacity testing to ensure optimal performance and longevity. For the WWT components, MBR membranes, for instance, demand monthly clean-in-place (CIP) cycles to maintain flux rates and prevent fouling. Thirdly, the modular nature of both PV arrays and advanced WWT equipment (e.g., additional MBR trains) ensures excellent scalability. The hybrid system design can effectively scale from 100 m³/day to 2,000 m³/day or more, accommodating varying production capacities. Fourthly, early and proactive engagement with local environmental agencies is paramount to ensure the proposed system design and effluent quality meet all relevant discharge standards, particularly for specific contaminants like silica, which are unique to PV manufacturing wastewater. Finally, prioritizing the reuse of RO-treated water for panel cleaning and other non-potable uses maximizes financial savings by reducing freshwater intake by up to 95%, aligning with broader sustainability goals.
Frequently Asked Questions
Q: What is the typical payback period for a PV-powered wastewater treatment system?
A: The payback period for a PV-powered wastewater treatment system typically ranges from 3.8 to 5.2 years, depending on the system configuration (PV + Grid vs. PV + Battery vs. PV + Wind) and local energy costs. For a 500 m³/day facility, as in our case study, the payback period is 4.2 years, driven by annual operational savings of $460,000.
Q: Can PV systems power energy-intensive WWT processes like RO or MBR?
A: Yes, PV systems can power energy-intensive WWT processes, but hybrid systems are highly recommended for stability and reliability. A 300 kW PV array can cover 72% of a 500 m³/day WWT plant’s energy needs. For high-demand processes like RO, which consumes 0.5-1.0 kWh/m³, grid power or battery storage provides essential backup, ensuring continuous operation.
Q: What contaminants are removed by a hybrid PV-WWT system?
A: The hybrid MBR-DAF-RO system effectively removes a broad spectrum of contaminants found in PV manufacturing wastewater, including silica (<10 mg/L), heavy metals (<0.1 mg/L), TSS (<5 mg/L), and COD (<50 mg/L). This robust treatment train is specifically designed to handle challenging constituents such as IPA, NMP, and various metal oxides.
Q: How much maintenance does a PV-WWT system require?
A: PV panels require relatively low maintenance, primarily quarterly cleaning to prevent dust accumulation, which can reduce efficiency by 5-10%. Battery systems need annual capacity testing. The WWT equipment, particularly MBR membranes, requires more frequent attention, typically involving monthly CIP (clean-in-place) procedures to maintain optimal flux rates and prevent fouling.
Q: Are there government incentives for PV-WWT systems?
A: Yes, numerous government incentives exist globally to encourage the adoption of PV-WWT systems. In China, substantial solar subsidies can reduce CAPEX by 20-30%. In the EU, programs like Horizon Europe funding support energy-efficient wastewater treatment projects. In the US, the Inflation Reduction Act offers significant incentives, including a 30% investment tax credit for solar installations, making these systems more financially attractive.