PV Wastewater Treatment Solution: 2025 Hybrid ZLD System Design with 95% Recovery & Cost Breakdown
Achieving zero liquid discharge (ZLD) and 95% water recovery in solar PV wastewater treatment solutions by 2025 necessitates integrated hybrid systems combining selective contaminant extraction (SCE), reverse osmosis (RO), and ultrafiltration (UF). While advanced RO systems typically recover 85% of wastewater for on-site reuse, optimized hybrid designs push recovery rates to 95% through upstream integration of technologies like lamella clarifiers and membrane bioreactors (MBR). Key contaminants—including fluoride (5–500 mg/L), ammonia (10–200 mg/L), and heavy metals (10–1,000 ppm)—demand tailored pretreatment, such as chemical precipitation for fluoride or ion exchange for ammonia, prior to RO polishing. Capital expenditure (CAPEX) for a 50–200 m³/h system ranges from $1.2M to $4.5M, with operational expenditure (OPEX) between $0.80 and $2.50/m³ treated, depending on specific recovery targets and local water costs.
Why PV Manufacturers Need Zero Liquid Discharge (ZLD) Wastewater Solutions
Solar PV manufacturing consumes 3–5 m³ of water per MW of panel production, with 60–80% lost as wastewater in cleaning, etching, and rinsing processes, as reported by IRENA in 2024. This significant water footprint, coupled with increasingly stringent environmental regulations, compels PV manufacturers to adopt advanced wastewater treatment solutions, particularly ZLD systems. China’s GB 31573-2015 and the EU Industrial Emissions Directive 2010/75/EU set strict discharge limits, including fluoride at 10 mg/L and ammonia at 15 mg/L for PV wastewater, with 2025 updates anticipated to further tighten these requirements. Non-compliance with these regulations carries substantial financial and operational risks, ranging from hefty fines and production shutdowns to severe reputational damage.
Water scarcity is another critical driver for ZLD adoption. Regions with high solar PV production, such as parts of Asia and North America, often face severe water stress, making water reuse economically and environmentally imperative. For example, a 1 GW/year PV fab in China's Jiangsu Province successfully reduced its water consumption by 40% and avoided an estimated $1.8M/year in discharge fees by implementing a ZLD system, demonstrating the tangible financial benefits of such investments. Beyond compliance and cost savings, ZLD systems align with corporate sustainability goals, enhancing a company's environmental stewardship and market appeal. By eliminating liquid discharge, PV manufacturers can minimize their environmental impact, conserve freshwater resources, and secure their social license to operate in water-sensitive areas. This strategic shift towards comprehensive water management is no longer optional but a fundamental requirement for long-term viability in the global solar industry.
Key Contaminants in PV Wastewater and Their Treatment Challenges
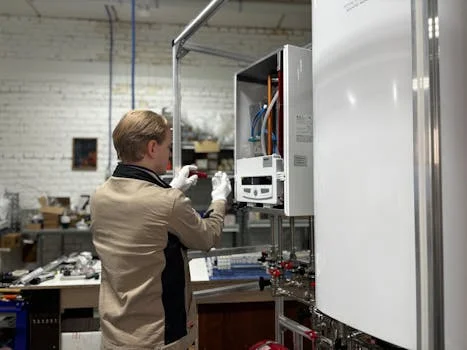
PV manufacturing wastewater streams contain a complex mix of contaminants that pose significant challenges for conventional treatment methods. The primary problematic constituents include fluoride, ammonia, heavy metals, and silica, each requiring specialized removal strategies to meet stringent discharge and reuse standards.
Fluoride concentrations in PV wastewater typically range from 5 mg/L to as high as 500 mg/L, primarily originating from hydrofluoric acid etching processes. Fluoride is highly corrosive and can severely damage RO membranes if not adequately pretreated. Effective removal often involves chemical precipitation using calcium hydroxide or calcium chloride, which can achieve 90–98% removal efficiency, forming insoluble calcium fluoride. For higher concentrations or tighter effluent limits, adsorption with activated alumina or ion exchange resins may be necessary. For more detailed insights into fluoride removal costs, refer to our article on cost breakdown for fluoride removal in PV wastewater.
Ammonia, present at concentrations of 10–200 mg/L, is another critical contaminant, often stemming from cleaning agents and etching solutions. Ammonia is volatile, toxic to aquatic life, and contributes to eutrophication. Removal methods typically include ion exchange, air stripping, or biological nitrification-denitrification processes. Hybrid systems, combining selective contaminant extraction (SCE) with RO, have demonstrated 95–99% ammonia removal efficiency, ensuring compliance with strict discharge limits.
Heavy metals, such as nickel, chromium, copper, zinc, and lead, can be found in PV wastewater at concentrations ranging from 10 ppm to over 1,000 ppm. These metals are highly toxic and must be reduced to very low levels, often less than 1 ppm, before discharge or reuse. Common treatment methods include chemical precipitation (e.g., pH adjustment with caustic soda to form insoluble metal hydroxides), dissolved air flotation (DAF), and ion exchange. The choice of treatment depends on the specific metal profile and target effluent concentrations.
Silica and various organic compounds (e.g., surfactants, solvents) are also prevalent, presenting significant fouling risks for RO membranes. High silica concentrations can lead to scaling, while organics can cause biofouling and irreversible membrane damage. Pretreatment steps like ultrafiltration (UF) or multimedia filtration are crucial to remove suspended solids, colloids, and some organic matter, thereby protecting downstream RO membranes and extending their operational lifespan. Understanding these contaminant characteristics is vital for designing a robust and efficient PV wastewater treatment solution.
| Contaminant | Typical Influent Range (PV Wastewater) | Primary Treatment Method(s) | Typical Removal Efficiency | Effluent Target (Discharge/Reuse) |
|---|---|---|---|---|
| Fluoride | 5–500 mg/L | Chemical Precipitation (Ca(OH)₂, CaCl₂), Adsorption, Ion Exchange | 90–98% (Precipitation) | <10 mg/L (Discharge), <1 mg/L (Reuse) |
| Ammonia | 10–200 mg/L | Ion Exchange, Air Stripping, Biological Treatment, SCE | 95–99% | <15 mg/L (Discharge), <1 mg/L (Reuse) |
| Heavy Metals (Ni, Cr, Cu) | 10–1,000 ppm | Chemical Precipitation (pH adjustment), DAF, Ion Exchange | >99% | <1 ppm (Discharge), <0.1 ppm (Reuse) |
| Suspended Solids (TSS) | 100–5,000 mg/L | Coagulation-Flocculation, Sedimentation, DAF, UF | >95% | <10 mg/L (Discharge), <1 mg/L (Reuse) |
| Silica | 20–150 mg/L | Chemical Precipitation, Adsorption, UF | 80–95% | <5 mg/L (RO Feed), <0.5 mg/L (Reuse) |
Hybrid PV Wastewater Treatment System Design: Step-by-Step Process Flow
A robust hybrid PV wastewater treatment system design integrates multiple technologies in a sequential process flow to achieve high recovery rates and stringent contaminant removal. This modular approach allows for customization based on influent characteristics and desired effluent quality, typically targeting 95% water recovery and ZLD compliance.
- Pretreatment: Acid Waste Neutralization (AWN)
The initial step involves acid waste neutralization (AWN) systems to adjust the pH of incoming wastewater, which can range from 2 to 12, to a neutral range of 6–9. This is critical for downstream processes and membrane protection. Reagent chemicals like caustic soda (NaOH) or sulfuric acid (H₂SO₄) are precisely metered using advanced feed-forward control strategies to maintain stable pH. Typical flow rates for AWN systems can vary from less than 1 gpm to over 400 gpm, accommodating diverse PV fab capacities. - Primary Treatment: Dissolved Air Flotation (DAF)
Following pH adjustment, primary treatment often employs a DAF system for PV wastewater pretreatment. DAF systems are highly effective at removing 90–95% of suspended solids (TSS), oil and grease (FOG), and some heavy metals precipitated during the AWN stage. The process involves saturating a portion of the treated effluent with air under pressure, then releasing it into the DAF tank, creating micro-bubbles (30–50 μm). These bubbles attach to suspended particles, floating them to the surface for mechanical skimming, thereby significantly reducing the load on subsequent treatment stages. - Secondary Treatment: Selective Contaminant Extraction (SCE) and Ultrafiltration (UF)
After DAF, secondary treatment focuses on targeted removal of specific contaminants and further particulate reduction. Selective Contaminant Extraction (SCE) technologies are deployed for high-efficiency removal of dissolved fluoride and ammonia. For fluoride, this might involve advanced adsorption or ion exchange. For ammonia, ion exchange resins or specialized stripping processes are used. This stage is crucial as it prevents these challenging contaminants from reaching and damaging delicate downstream membranes. Following SCE, ultrafiltration (UF) systems, typically with 0.01–0.1 μm pore sizes, provide an essential barrier. UF effectively removes remaining suspended solids, colloids, macromolecules, and microorganisms, acting as critical pretreatment to protect the RO membranes from fouling. Advanced hybrid designs leveraging SCE and UF can achieve initial water recovery rates of 85–95% before final polishing. - Polishing: Reverse Osmosis (RO)
The polishing stage utilizes high-recovery RO systems for PV wastewater recycling to achieve the highest water quality suitable for reuse or ZLD. RO membranes, typically made of polyamide, reject dissolved salts, remaining heavy metals, and residual organics, pushing recovery rates up to 95%. To maintain optimal performance, RO systems require regular cleaning-in-place (CIP) protocols, often using citric acid for scale removal and sodium hydroxide for organic fouling. Understanding RO system efficiency and process parameters for PV wastewater is essential for long-term operational success. - Sludge Handling: Plate and Frame Filter Presses
Throughout the treatment process, sludge is generated from chemical precipitation, DAF, and membrane cleaning. Efficient sludge management is vital. Sludge dewatering solutions for PV wastewater treatment, such as plate and frame filter presses, are used to dewater the sludge, increasing its solids content to 30–40%. This significantly reduces sludge volume, lowering disposal costs. Dewatered sludge can then be disposed of in landfills, or in some cases, further processed for metal recovery, aligning with circular economy principles.
For more comprehensive engineering specifications and blueprints, consider reviewing detailed engineering specs for PV wastewater treatment projects.
Recovery Rates and Contaminant Removal: How to Choose the Right System for Your PV Fab
Selecting the optimal PV wastewater treatment system hinges on balancing desired water recovery rates, contaminant removal efficiencies, and economic considerations. Achieving high recovery and stringent removal targets, particularly for challenging contaminants like fluoride and ammonia, often necessitates a hybrid approach beyond conventional methods.
The table below compares three common system types, highlighting their performance metrics:
| System Type | Recovery Rate (%) | Fluoride Removal (%) | Ammonia Removal (%) | Heavy Metal Removal (%) | CAPEX ($/m³ treated) | OPEX ($/m³ treated) |
|---|---|---|---|---|---|---|
| Conventional (Coagulation, Sedimentation, Activated Carbon) | 60–75% | 70–85% | 40–60% | 85–95% | $2,000–$4,000 | $0.50–$1.20 |
| Hybrid (DAF, UF, RO) | 85–90% | 90–95% | 70–85% | >98% | $4,000–$8,000 | $0.80–$1.80 |
| Hybrid ZLD (DAF, SCE, UF, High-Recovery RO, Evaporator/Crystallizer) | 95–99% | 98–99.9% | 95–99% | >99.9% | $8,000–$15,000+ | $1.50–$3.00+ |
Use-case Matching: Batch vs. Continuous Systems
- Batch Systems: Ideal for smaller PV fabs or specific waste streams with flow rates typically less than 50 m³/h. They offer flexibility for varying influent compositions and allow for precise chemical dosing and reaction times, which can be advantageous for highly concentrated or inconsistent waste.
- Continuous Systems: Essential for larger PV manufacturing facilities with consistent, high-volume wastewater flows, generally exceeding 100 m³/h. Continuous systems provide steady-state operations, higher throughput, and are often more automated, leading to lower labor costs per cubic meter treated.
Chemical vs. Physical Treatment
- Chemical Precipitation: Offers a relatively low CAPEX solution for heavy metal and fluoride removal, relying on pH adjustment and coagulants. However, it generates significant volumes of sludge, incurring higher sludge disposal OPEX.
- Ion Exchange: Provides high removal efficiencies for specific ions like ammonia and certain heavy metals. While its CAPEX can be higher due to specialized resins and regeneration systems, it typically produces less sludge than chemical precipitation, potentially lowering long-term disposal costs. Regeneration chemicals and waste brine management are key operational considerations.
ZLD vs. Partial Recovery
The decision between ZLD and partial recovery systems is primarily driven by regulatory pressure, water scarcity, and economic payback. ZLD systems, while adding 30–50% to the initial CAPEX compared to partial recovery systems, eliminate all liquid discharge, thus avoiding discharge fees and maximizing water reuse. For PV fabs located in water-scarce regions (e.g., Xinjiang, California), or those facing stringent discharge limits, ZLD systems can offer a compelling return on investment, with payback periods often estimated between 3–5 years due to significant water savings (up to $2.00/m³) and avoided discharge penalties.
A comprehensive decision framework should evaluate regulatory compliance, water costs, available space, energy consumption, and long-term operational sustainability to select the most suitable PV wastewater treatment solution.
2025 Cost Breakdown for PV Wastewater Treatment Systems: CAPEX, OPEX, and ROI
Understanding the detailed cost structure of a PV wastewater treatment system is crucial for informed investment decisions and building a robust business case. The total cost is influenced by factors such as system capacity, target recovery rates, and the complexity of contaminant removal.
CAPEX Breakdown for a 50–200 m³/h System: $1.2M–$4.5M
- Pretreatment (AWN, Coagulation/Flocculation): $200K–$800K. This includes tanks, mixers, dosing pumps for pH adjustment chemicals (caustic soda, sulfuric acid), and basic instrumentation.
- Primary Treatment (DAF): $150K–$500K. Costs cover the DAF unit, air saturation system, pumps, and skimmers.
- Secondary Treatment (SCE/UF): $300K–$1.2M. This segment includes specialized equipment for selective contaminant extraction (e.g., ion exchange resins for ammonia, adsorption media for fluoride), UF membrane modules, pumps, and associated controls.
- Polishing (RO): $200K–$800K. This covers high-pressure pumps, RO membrane arrays, pressure vessels, and CIP systems.
- Sludge Handling (Filter Press): $100K–$300K. Includes the plate and frame filter press unit, sludge pumps, and polymer dosing systems.
- Ancillary Equipment & Installation: This typically accounts for 15-25% of the total equipment cost, covering piping, electrical, civil works, and commissioning.
OPEX Breakdown for a 50–200 m³/h System: $0.80–$2.50/m³ Treated
- Energy: $0.20–$0.50/m³. Energy consumption is primarily driven by pumps (high-pressure RO, recirculation), blowers (DAF), and agitators. Higher recovery systems, especially those incorporating thermal evaporators for ZLD, will have higher energy demands.
- Chemicals: $0.10–$0.30/m³. This includes pH adjustment reagents, coagulants, flocculants, antiscalants for RO, and cleaning chemicals for membranes.
- Membrane Replacement: $0.15–$0.40/m³. UF membranes typically last 5–10 years, while RO membranes last 3–5 years, depending on influent quality and effective pretreatment. This cost amortizes the replacement of membrane elements over their lifespan.
- Labor: $0.10–$0.20/m³. Covers operator salaries, maintenance, and routine monitoring.
- Sludge Disposal: $0.05–$0.15/m³. Costs associated with transporting and landfilling dewatered sludge. These costs can vary significantly based on local regulations and landfill tipping fees.
ROI Drivers and Payback
The return on investment (ROI) for a PV wastewater treatment system is driven by several factors:
- Water Savings: With local industrial water costs ranging from $0.50–$2.00/m³, high-recovery systems deliver substantial savings by reducing reliance on fresh water sources.
- Discharge Fee Avoidance: Eliminating or significantly reducing wastewater discharge can save $0.10–$0.50/m³ in discharge fees and penalties.
- Government Incentives: Many regions offer incentives for sustainable water management. For example, some jurisdictions in China provide up to a 30% subsidy for ZLD system installations.
- Risk Mitigation: Avoiding production shutdowns due to non-compliance or water scarcity provides intangible but significant financial protection.
Case Study Example: A 100 m³/h hybrid ZLD system implemented in a Malaysian PV fab achieved a 3.2-year payback period. This was realized through a 90% reduction in freshwater consumption and the complete elimination of discharge fees, demonstrating the strong economic viability of advanced PV wastewater treatment solutions.
Frequently Asked Questions

Q: What is the maximum fluoride concentration that can be treated with chemical precipitation?
A: Chemical precipitation, typically using calcium hydroxide or calcium chloride, can effectively treat fluoride concentrations up to 500 mg/L, achieving 90–98% removal efficiency. For influent concentrations exceeding 500 mg/L or for more stringent effluent targets, advanced adsorption (e.g., activated alumina) or ion exchange is often required as a polishing step.
Q: How often do RO membranes need replacement in PV wastewater treatment?
A: RO membranes typically last 3–5 years in PV wastewater applications. Their lifespan is highly dependent on the effectiveness of upstream pretreatment, the quality of the incoming wastewater, and the frequency of proper cleaning-in-place (CIP) protocols. Annual cleaning cycles with chemicals like citric acid (for scale) or sodium hydroxide (for organic fouling) are crucial for extending membrane longevity.
Q: Can PV wastewater be reused in upstream processes?
A: Yes, treated PV wastewater can be safely reused in various upstream processes within the manufacturing plant, particularly for non-critical rinsing steps (e.g., pre-cleaning, general utility water). For reuse, the treated water, especially RO permeate, must meet specific quality targets, such as conductivity below 10 μS/cm and total organic carbon (TOC) below 1 ppm, to prevent product contamination or equipment damage.
Q: What are the discharge limits for ammonia in PV wastewater?
A: China’s GB 31573-2015 sets a discharge limit of 15 mg/L for ammonia in PV manufacturing wastewater. The EU Industrial Emissions Directive 2010/75/EU is stricter, with a typical limit of 10 mg/L for industrial wastewater discharges, reflecting a global trend towards tighter environmental regulations for ammonia.
Q: How does a hybrid SCE + RO system compare to standalone RO for PV wastewater?
A: Hybrid Selective Contaminant Extraction (SCE) + Reverse Osmosis (RO) systems achieve significantly higher performance, typically reaching 95% water recovery and 99% contaminant removal. In contrast, standalone RO systems usually yield 75–85% recovery and 90–95% contaminant removal. While hybrid systems have a 20–30% higher CAPEX due to the additional specialized treatment stages, their OPEX can be 10–15% lower over the long term, primarily due to reduced RO membrane fouling and extended membrane lifespan resulting from superior pretreatment.