TFT-LCD Wastewater Treatment Price 2025: Cost Breakdown, Tech Selection & ROI Calculator
TFT-LCD wastewater treatment costs in 2025 vary significantly by system type: electro-Fenton processes average $0.15–$0.30/m³ (energy cost $0.1/L per ASCE 2023 data), while hybrid systems (DAF + MBR) range from $0.20–$0.45/m³. CAPEX for a 100 m³/h system starts at $500K for basic biological treatment, rising to $2M+ for zero-liquid-discharge (ZLD) configurations. Key cost drivers include influent COD (500–2,000 mg/L), local electricity rates, and stringent discharge limits (e.g., China’s GB 8978-2023).Why TFT-LCD Wastewater Treatment Costs Are Rising in 2025
Stricter regulatory discharge limits for TFT-LCD effluent are the primary drivers behind escalating treatment costs in 2025. China’s GB 8978-2023 and the EU Industrial Emissions Directive 2010/75/EU now mandate COD levels below 50 mg/L and TSS below 30 mg/L for TFT-LCD wastewater, a significant reduction from the 100 mg/L limits prevalent in 2020. This tightening of standards necessitates more advanced and energy-intensive treatment processes. Influent COD in TFT-LCD wastewater typically ranges from 500–2,000 mg/L (per Top 3 study), requiring multi-stage treatment trains that often include robust pretreatment, biological processes, and advanced polishing to meet the new stringent limits. The energy consumption of these advanced systems significantly impacts operational expenditure. For instance, electro-Fenton systems incur substantial energy costs, estimated at $0.1/L according to ASCE 2023 data, primarily due to the electricity required for electrolysis. Similarly, Membrane Bioreactor (MBR) aeration demands 0.5–1.0 kWh/m³, and these energy costs are rising due to global electricity price increases (IEA 2024). Beyond energy, the expansion of TFT-LCD manufacturing facilities, such as the development of Gen 10.5 plants, leads to increased wastewater flow rates. Higher flow rates necessitate larger treatment systems, which directly translates into higher CAPEX for equipment, installation, and infrastructure. The need for specialized chemicals, skilled labor, and more frequent maintenance for complex systems further contributes to the upward trend in overall wastewater treatment expenditure for semiconductor fabs.TFT-LCD Wastewater Treatment System Cost Breakdown: CAPEX vs. OPEX
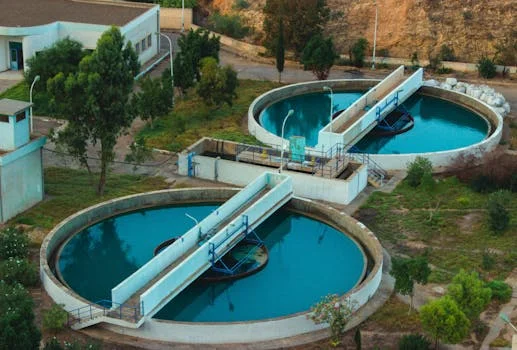
- Pretreatment (e.g., equalization, pH adjustment): $100K–$200K
- DAF system: $200K–$300K (for DAF systems for TFT-LCD wastewater pretreatment)
- Biological treatment (e.g., MBR tanks, membranes, blowers): $300K–$500K (for integrated MBR systems for TFT-LCD effluent polishing, including membrane modules, aeration systems, and associated pumps)
- Sludge dewatering (e.g., filter press, centrifuge): $150K–$250K
- Control systems (PLC, SCADA): $80K–$150K
- Installation, piping, civil works: $300K–$500K
| Cost Category | Component | Estimated Cost (100 m³/h System) | Notes |
|---|---|---|---|
| CAPEX | Pretreatment (Equalization, pH) | $100K–$200K | Tanks, pumps, mixers, pH sensors |
| DAF System | $200K–$300K | DAF tank, air saturation system, pumps, skimmer | |
| MBR System | $300K–$500K | MBR membranes, aeration blowers, pumps, controls | |
| Sludge Dewatering | $150K–$250K | Filter press or centrifuge, polymer dosing | |
| Control Systems | $80K–$150K | PLC, SCADA, instrumentation | |
| Installation & Civil Works | $300K–$500K | Piping, electrical, concrete pads, structural work | |
| OPEX (per m³) | Energy (Electricity) | $0.08–$0.20/m³ | Pumps, blowers, electro-Fenton (if applicable) |
| Chemicals (Coagulants, Flocculants) | $0.05–$0.15/m³ | PAC, PAM, polymers | |
| Chemicals (pH Adjustment) | $0.02–$0.08/m³ | H₂SO₄, NaOH | |
| Labor | $0.03–$0.10/m³ | Operator salaries, training | |
| Maintenance & Spares | $0.02–$0.07/m³ | Membrane replacement (amortized), pump repairs, sensor calibration |
Hybrid System Comparison: Electro-Fenton vs. DAF + MBR vs. ZLD
Choosing the optimal TFT-LCD wastewater treatment system requires a thorough comparison of removal efficiency, operational costs, footprint, and scalability. Each technology offers distinct advantages and disadvantages depending on influent characteristics and discharge requirements. Electro-Fenton processes achieve 90–95% COD removal, with OPEX typically ranging from $0.15–$0.30/m³, primarily driven by energy consumption for electrode operation. While compact, this technology is generally limited to flows below 500 m³/h due to potential electrode scaling issues and sludge generation. Compliance with stringent TSS limits can be challenging for electro-Fenton alone. DAF + MBR hybrid systems offer superior performance, achieving 95–99% COD and TSS removal. Their OPEX falls within $0.20–$0.45/m³, balancing chemical, energy, and labor costs. These systems are highly scalable, proven in Top 5 biological studies to handle flows exceeding 1,000 m³/h, making them suitable for larger Gen 10.5 fabs. The combination of DAF systems for robust suspended solids removal and integrated MBR systems for biological treatment ensures consistent compliance with stringent standards like China’s GB 8978-2023. While requiring a moderate footprint, their reliability and high effluent quality often justify the investment. Zero-Liquid-Discharge (ZLD) systems represent the pinnacle of water recovery, achieving 99.9% water reuse. However, this comes at a significantly higher cost, with OPEX ranging from $0.50–$1.00/m³ and CAPEX for a 100 m³/h system often exceeding $2M, due to the inclusion of advanced evaporators, crystallizers, and brine management. ZLD systems have a large footprint and require specialized ZLD engineering blueprints for TFT-LCD wastewater to manage the concentrate effectively. While they exceed all discharge limits, the high CAPEX and OPEX, alongside the challenges of brine disposal, make them primarily suitable for regions with extreme water scarcity or very strict discharge regulations. For further insights into advanced treatment, explore acid-alkaline wastewater treatment solutions for semiconductor fabs.| Feature | Electro-Fenton | DAF + MBR Hybrid | Zero-Liquid-Discharge (ZLD) |
|---|---|---|---|
| COD Removal Efficiency | 90–95% | 95–99% | >99.9% (water recovery) |
| TSS Removal Efficiency | 70–85% (can struggle) | 98–99% | >99.9% |
| Typical OPEX (per m³) | $0.15–$0.30 | $0.20–$0.45 | $0.50–$1.00 |
| Typical CAPEX (100 m³/h) | $800K–$1.2M | $1.2M–$1.8M | >$2M |
| Scalability | Limited (<500 m³/h due to electrode issues) | High (1,000+ m³/h) | Moderate (complex for very large flows) |
| Footprint | Compact | Moderate | Large |
| Compliance Capability | May struggle with strict TSS/COD; requires polishing | Meets GB 8978-2023, EU IED | Exceeds all limits, but requires brine disposal |
| Primary Application | Smaller flows, high COD, specific organic removal | Medium to large flows, high effluent quality needs | Extreme water scarcity, zero discharge mandate |
ROI Calculator: How to Justify TFT-LCD Wastewater Treatment Investment
Payback Period = (Total CAPEX) / (Annual OPEX Savings + Annual Fine Avoidance + Annual Water Reuse Savings)
Consider an example: a 200 m³/h DAF + MBR system with a CAPEX of $1.5M. This system is projected to save $300K/year in fines by preventing GB 8978-2023 violations, which can range from $10K–$50K per incident (China EPA 2024). Additionally, with 50% water recovery, the system generates $200K/year in water reuse savings. Recovered water, valued at approximately $0.50/m³, significantly offsets municipal supply costs, which can be as high as $1.20/m³ in major industrial zones like Shanghai. If the OPEX for the new system is comparable to or lower than the previous system's operational costs (or if the previous system incurred very high disposal costs), these savings contribute directly to the payback calculation. In this scenario, the annual benefits total $500K ($300K fines + $200K water reuse).Payback Period = $1,500,000 / $500,000 = 3 years.
This 3-year payback period demonstrates a strong financial case for investment. To use this calculator, procurement managers and environmental engineers should input their specific data:- Flow Rate (m³/h): Determine the average and peak wastewater flow.
- Influent COD (mg/L): Characterize the raw wastewater.
- Local Electricity Cost ($/kWh): Obtain current industrial rates.
- Current Water Supply Cost ($/m³): Cost of fresh municipal or industrial water.
- Estimated Fine Avoidance ($/year): Based on historical non-compliance or potential risk.
- Target Water Recovery Rate (%): Desired reuse percentage.
- Estimated CAPEX for Chosen System: Obtain quotes for DAF + MBR, ZLD, or other relevant systems.
- Estimated OPEX for Chosen System: Include energy, chemical, labor, and maintenance costs.
Compliance Checklist: Meeting TFT-LCD Wastewater Discharge Limits in 2025
Adhering to evolving environmental regulations is non-negotiable for TFT-LCD manufacturers, with compliance directly impacting operational continuity and financial performance. Global standards for wastewater discharge have become increasingly stringent.| Parameter | China GB 8978-2023 | EU Industrial Emissions Directive | US EPA (Pretreatment for POTW) |
|---|---|---|---|
| COD | <50 mg/L | <125 mg/L | <250 mg/L (typical) |
| TSS | <30 mg/L | <60 mg/L | <150 mg/L (typical) |
| NH₃-N | <15 mg/L | <20 mg/L | Varies by POTW |
| pH | 6–9 | 6–9 | 6–9 |
| Heavy Metals (e.g., Cu) | <0.5 mg/L | <0.5 mg/L | Varies by POTW |
- Regular Influent and Effluent Testing: Conduct monthly (or more frequent) sampling and analysis of both raw wastewater and treated effluent to monitor key parameters against regulatory limits.
- Sensor Calibration and Maintenance: Ensure all online sensors (pH, ORP, TSS, flow meters) are regularly calibrated and maintained to provide accurate real-time data for process control and compliance reporting.
- Chemical Dosing Documentation: Maintain meticulous logs of chemical consumption, including types, quantities, and dosing rates for coagulants, flocculants, and pH adjustment chemicals, especially for automatic chemical dosing systems.
- Operator Training and Emergency Protocols: Provide continuous training for operators on system operation, troubleshooting, and emergency response procedures for spills, system malfunctions, or non-compliant discharge events.
- Sludge Management: Ensure proper handling, dewatering, and disposal of sludge in accordance with local hazardous waste regulations, documenting all disposal manifests.
- Record Keeping and Reporting: Keep comprehensive records of all monitoring data, maintenance activities, chemical purchases, and regulatory reports for audit purposes.
Frequently Asked Questions
What is the most cost-effective TFT-LCD wastewater treatment system?
For flows under 500 m³/h, a DAF + MBR hybrid system generally offers the best balance of CAPEX ($1.2M–$1.8M for 100 m³/h) and OPEX ($0.20–$0.45/m³), reliably meeting stringent discharge limits. For smaller flows below 100 m³/h with specific organic load profiles, an electro-Fenton system might be more cost-effective with OPEX ranging from $0.15–$0.30/m³.How much does it cost to treat 1 m³ of TFT-LCD wastewater?
The operational expenditure (OPEX) to treat 1 m³ of TFT-LCD wastewater varies significantly by technology. It can range from $0.15/m³ for basic electro-Fenton processes to $0.45/m³ for advanced DAF + MBR hybrid systems, and up to $1.00/m³ for Zero-Liquid-Discharge (ZLD) configurations. Capital expenditure (CAPEX) can be estimated at $5–$20 per m³/day of treatment capacity, depending on the system's complexity and required effluent quality.What are the hidden costs of TFT-LCD wastewater treatment?
Hidden costs often include membrane replacement ($50K–$100K every 5–7 years for MBR systems), specialized chemical storage requirements (e.g., HAZMAT compliance, dedicated facilities), and increasing sludge disposal costs ($200–$500/ton, varying by region and sludge characteristics). Additionally, unforeseen maintenance, power fluctuations, and operator training can add to the total cost.Can TFT-LCD wastewater be reused?
Yes, TFT-LCD wastewater can be effectively reused, particularly with advanced treatment systems such as Zero-Liquid-Discharge (ZLD) or highly efficient MBR followed by Reverse Osmosis (RO) systems. These technologies can achieve water recovery rates of 90–95%, providing a significant offset to fresh water consumption. However, these systems have a high CAPEX, typically exceeding $2M for a 100 m³/h ZLD configuration.What are the penalties for non-compliance with TFT-LCD wastewater limits?
Penalties for non-compliance with TFT-LCD wastewater discharge limits are severe and vary by region. In China, violations of GB 8978-2023 can result in fines ranging from $10K–$50K per incident (China EPA 2024), alongside potential production halts. In the EU, the Industrial Emissions Directive allows for fines up to €1M, and repeated violations can lead to plant closures or criminal charges for responsible parties.Related Equipment
- DAF systems for TFT-LCD wastewater pretreatment — view specifications, capacity range, and technical data
- Integrated MBR systems for TFT-LCD effluent polishing — view specifications, capacity range, and technical data
- PLC-controlled chemical dosing for TFT-LCD wastewater pH adjustment — view specifications, capacity range, and technical data
Need a customized solution? Request a free quote with your specific flow rate and pollutant parameters.