PCB Wastewater Treatment Price 2025: Cost Breakdown, Tech Selection & ROI Calculator for ZLD Systems
In 2025, PCB wastewater treatment costs range from $500,000 to $5 million for zero-liquid-discharge (ZLD) systems, with operating expenses of $0.12–$0.45 per cubic meter. Hybrid systems combining dissolved air flotation (DAF), reverse osmosis (RO), and evaporation achieve 99.8% heavy metals removal (copper, nickel, tin) and comply with China’s GB8978-2022 limits (0.5 mg/L copper). For a 50 m³/h plant, a DAF + RO system costs ~$1.2M CAPEX and $0.22/m³ OPEX, while a full ZLD system with evaporation reaches $3.5M CAPEX and $0.38/m³ OPEX.
Why PCB Wastewater Treatment Costs More Than Standard Industrial Effluent
PCB manufacturing generates 5 to 10 distinct wastewater streams, including etching, plating, and developer rinses, which contain heavy metal concentrations up to 300 mg/L and complexing agents like EDTA that prevent standard precipitation. Unlike general industrial effluent, PCB wastewater requires advanced segregation because mixing chelated copper streams with alkaline rinses creates stable complexes that bypass traditional clarifiers. Effective treatment necessitates a multi-stage approach: chemical de-complexation, followed by a high-efficiency DAF system for PCB wastewater pretreatment, and finally membrane polishing.
These streams vary significantly in composition and treatment demands. Etching processes contribute high copper loads (50–300 mg/L), while electroless nickel plating introduces phosphorous and nickel (10–150 mg/L). Fluoride concentrations from micro-etching often range between 20 and 150 mg/L, necessitating specialized calcium precipitation stages. China’s GB8978-2022 standards have intensified the financial pressure on facilities, setting strict limits for copper (0.5 mg/L), nickel (1.0 mg/L), and cyanide (0.5 mg/L). According to MEE 2023 enforcement data, non-compliance penalties for medium-sized PCB plants now average $150,000 per year in administrative fines and lost production time.
The economic impact of specialized treatment is best illustrated by a case example from Jiangsu. A 30 m³/h PCB facility faced consistent fines for copper exceedances reaching 1.2 mg/L. By implementing a dedicated pretreatment line using PLC-controlled chemical dosing for PCB wastewater pH adjustment and coagulation followed by DAF and RO, the plant reduced effluent copper to 0.3 mg/L. This upgrade allowed the facility to avoid $90,000 per year in fines while achieving a 75% water reuse rate.
| Wastewater Stream | Primary Contaminants | Typical Concentration (mg/L) | Treatment Difficulty |
|---|---|---|---|
| Etching Rinse | Cu, NH3-N, Cl- | Cu: 50–300 | High (Complexed Metals) |
| Electroplating Rinse | Ni, Sn, Pb, Acid | Ni: 20–150 | Moderate |
| Developer/Stripper | COD, Carbonate | COD: 3,000–8,000 | Very High (Foaming) |
| Micro-etching | F-, H2O2, Cu | F: 20–150 | Moderate (Precipitation) |
| Complexed (EDTA) | Chelated Cu/Ni | Cu: 50–100 | Extreme (De-complexing) |
PCB Wastewater Treatment Technologies: Removal Efficiencies, Costs, and Use Cases
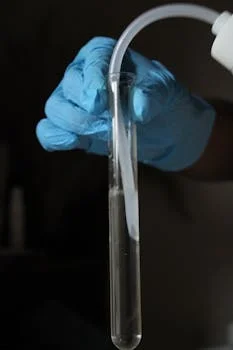
Dissolved Air Flotation (DAF) achieves 90–95% total suspended solids (TSS) removal and up to 80% heavy metals removal in PCB pretreatment, serving as a critical buffer for downstream membrane systems. DAF is particularly effective for treating etching rinse water and developer waste where oils and surfactants are prevalent. With an OPEX of $0.08–$0.15/m³, it remains the most cost-effective primary treatment stage for high-solids streams. However, to meet the sub-0.5 mg/L copper limits of GB8978-2022, DAF must be paired with secondary polishing.
For high-purity requirements, an RO system for PCB wastewater metals removal and water reuse is the industry standard. RO achieves 95–99% metals removal and 90% Total Dissolved Solids (TDS) reduction. The main technical challenge for RO in PCB environments is membrane fouling caused by organic brighteners and scale. This requires precise pH adjustment (6–8) and antiscalant dosing. For even more challenging streams, such as sludge dewatering filtrate or high-solids rinse water, Vibratory Shear Enhanced Processing (VSEP) offers a specialized RO variant. VSEP uses intense shear waves at the membrane surface to prevent fouling, maintaining 99% copper removal even at high feed concentrations, though its CAPEX is typically 20–30% higher than conventional RO systems.
When high organic loads are present (COD > 2,000 mg/L), a membrane bioreactor (MBR) is integrated into the process. MBRs combine biological degradation with ultrafiltration, achieving 95% COD removal. While MBRs struggle with heavy metals, they are essential for protecting RO membranes in hybrid systems. For facilities targeting Zero Liquid Discharge, evaporation (MVR or multi-effect) is the final stage. Evaporation provides 99.9% water recovery but carries the highest energy cost, ranging from $0.40 to $0.60 per cubic meter treated.
| Technology | Cu/Ni Removal % | COD Removal % | OPEX ($/m³) | Primary Use Case |
|---|---|---|---|---|
| DAF | 60–80% | 30–50% | $0.08–$0.15 | Pretreatment/TSS removal |
| RO | 95–99% | 80–90% | $0.20–$0.35 | Water reuse/Metal polishing |
| VSEP | 98–99.5% | 85–95% | $0.25–$0.40 | High-solids/Sludge filtrate |
| MBR | <20% | 90–95% | $0.25–$0.40 | Organic (COD) removal |
| Evaporation | 99.9% | 99% | $0.40–$0.60 | ZLD/TDS management |
2025 PCB Wastewater Treatment Cost Breakdown: CAPEX, OPEX, and ROI Calculator
Capital expenditure (CAPEX) for a 50 m³/h PCB wastewater treatment plant in 2025 ranges from $1.2 million for discharge-compliant systems to over $3.5 million for full zero-liquid-discharge (ZLD) configurations. These figures include core equipment, automated control systems, installation, and commissioning. For a standard discharge system utilizing DAF and RO, the equipment typically accounts for 60% of the CAPEX, with civil works and piping making up the remainder. In contrast, ZLD systems are heavily weighted toward the mechanical vapor recompression (MVR) units, which can represent 50% of the total project cost alone.
Operating expenses (OPEX) for PCB systems generally fall between $0.12 and $0.45 per cubic meter. HydropureWater field data from 2025 indicates that energy consumption is the largest single cost driver at 40%, followed by chemical reagents (coagulants, de-complexing agents) at 30%, and labor/maintenance at 20%. For example, a 50 m³/h plant operating 24/7 will spend approximately $120,000 annually on RO membrane replacements and specialized cleaning chemicals to combat fouling from plating additives. For a detailed PCB wastewater treatment cost analysis and ROI calculator, engineers must factor in the escalating price of sludge disposal, which has risen by 15% in major manufacturing hubs over the last two years.
To justify these expenditures, procurement teams use a specialized ROI calculator. The formula balances the high CAPEX of ZLD against the savings from water reuse and the avoidance of regulatory penalties. In Guangdong, a 70 m³/h PCB plant transitioned from traditional chemical precipitation to a hybrid DAF + RO system. While the initial investment was $1.8 million, the plant reduced its OPEX by 30% through chemical optimization and saved $80,000 annually in municipal water fees. The resulting payback period was 4.2 years, well within the typical 3–7 year benchmark for industrial upgrades.
| System Type (50 m³/h) | CAPEX Range ($M) | OPEX ($/m³) | Annual Maintenance ($) |
|---|---|---|---|
| Basic Discharge (DAF) | $0.5M – $0.8M | $0.12 – $0.18 | $45,000 |
| Compliance (DAF + RO) | $1.0M – $1.5M | $0.20 – $0.28 | $85,000 |
| Water Reuse (DAF+MBR+RO) | $1.8M – $2.5M | $0.25 – $0.35 | $110,000 |
| Full ZLD (Evaporation) | $3.0M – $5.0M | $0.38 – $0.60 | $180,000 |
How to Select the Right PCB Wastewater Treatment System: A Decision Framework
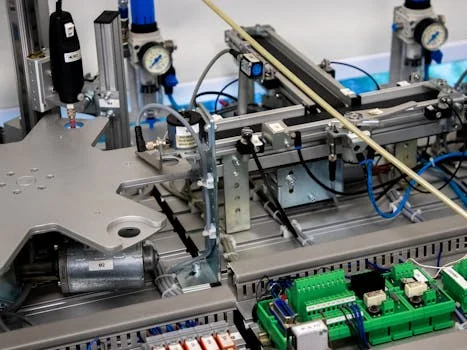
Selecting a PCB wastewater treatment system requires a four-step engineering audit that prioritizes contaminant mass balance over simple flow-rate calculations to ensure compliance with GB8978-2022 standards. The first step involves stream