Home>Blog>Buyer's Guide>Wastewater Treatment Plant Cost in South Africa 2026: Engineering Breakdown with Local Data, Compliance & ROI Calculator
Wastewater Treatment Plant Cost in South Africa 2026: Engineering Breakdown with Local Data, Compliance & ROI Calculator
Buyer's Guide
Zhongsheng Engineering Team
Wastewater Treatment Plant Cost in South Africa 2025: Engineering Breakdown with Local Data, Compliance & ROI Calculator
In 2025, wastewater treatment plant costs in South Africa range from R500,000 for a 10 m³/day compact MBR system to R5.2 billion for a 200,000 m³/day municipal plant like Potsdam. Capital costs average R15,000–R30,000 per m³/day capacity, while operational expenses (energy, chemicals, labor) add R2–R5 per m³ treated. Local compliance—including NEMA environmental permits (R50,000–R200,000) and DWS discharge fees (R1.20–R3.50/m³)—can inflate total costs by 15–25%. This guide provides engineering-grade cost breakdowns, technology comparisons, and an ROI calculator to help you budget accurately.
Why Wastewater Treatment Plant Costs Vary So Widely in South Africa
Wastewater treatment plant costs in South Africa are primarily driven by three critical factors: plant capacity, chosen technology, and local compliance requirements. Understanding these variables is essential for accurate project budgeting and avoiding unforeseen expenses. For instance, a 50 m³/day compact MBR system for a food processing plant in Johannesburg, requiring high-quality effluent for reuse, will have a significantly different cost profile than a 5,000 m³/day conventional activated sludge plant for a municipality in Limpopo, designed for basic discharge compliance.
Plant capacity, measured in cubic meters per day (m³/day), dictates the scale of civil works, equipment sizing, and operational resource allocation. Larger plants generally benefit from economies of scale in terms of R/m³/day for capital expenditure, but their absolute costs are substantially higher. Technology choice, such as membrane bioreactors (MBR), dissolved air flotation (DAF), or conventional activated sludge, directly impacts both initial capital outlay and long-term operational expenses. MBR systems, for example, offer superior effluent quality and a smaller footprint but typically incur higher capital and energy costs compared to conventional systems. Lastly, compliance with local regulations, including the National Environmental Management Act (NEMA) for environmental impact assessments, Department of Water and Sanitation (DWS) discharge licenses, and specific municipal bylaws, introduces a layer of permitting fees, monitoring costs, and potential penalties that can significantly inflate the total cost of ownership.
Beyond these primary drivers, several hidden costs often emerge during project development. Land acquisition, for example, can range from R500–R2,000 per square meter in urban areas, or significantly less in rural settings, but availability and zoning can be critical factors. Grid connection fees for electricity supply to large plants can add R200,000–R1 million to the initial investment. labor training and certification, crucial for competent plant operation, can cost R150,000–R500,000 for a team of qualified operators, ensuring efficient and compliant plant performance.
Capital Cost Breakdown by Plant Capacity and Technology
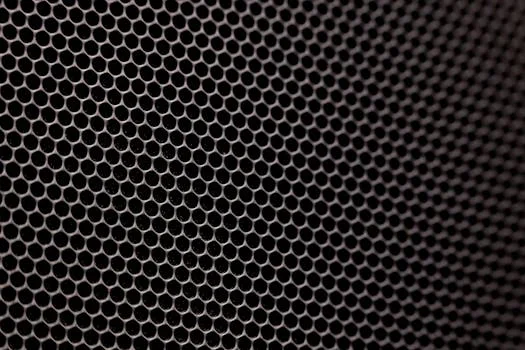
wastewater treatment plant cost in south africa - Capital Cost Breakdown by Plant Capacity and Technology
Capital expenditure (Capex) for a wastewater treatment plant in South Africa represents the initial investment in design, civil works, equipment, installation, and commissioning. The cost per cubic meter per day capacity generally decreases with scale, but the absolute investment increases dramatically. For instance, a 10 m³/day compact MBR system might cost R25,000/m³/day, totaling R250,000, while a 10,000 m³/day MBR plant could average R20,000/m³/day, equating to R200,000,000.
Conventional activated sludge systems are typically 30–50% cheaper in capital cost than MBR for capacities exceeding 200 m³/day. However, this cost saving comes with a trade-off in land requirements: conventional plants demand a significantly larger footprint, typically 0.5–1.0 m² per m³/day of capacity, compared to the compact 0.1–0.3 m² per m³/day needed for MBR systems. DAF systems are often deployed for industrial pretreatment or solids removal rather than full biological treatment, offering a lower R/m³/day cost for their specific function, making them a cost-effective solution for targeted applications.
Beyond the core treatment technology, ancillary costs form a substantial portion of the total capital expenditure. Civil works, encompassing earthworks, concrete structures, and buildings, typically account for 20–30% of the total capex. Electrical infrastructure, including power distribution, motor control centers, and lighting, often represents 10–15% of the budget. Automation and control systems, crucial for efficient plant operation and monitoring, add another 5–10%. For a large-scale municipal project like the Potsdam Wastewater Treatment Works, with a budget of R5.2 billion, the breakdown included approximately 40% for civil works, 25% for mechanical equipment, and 15% for electrical and instrumentation, demonstrating the significant allocation to non-process elements. For those evaluating specific technologies, Zhongsheng Environmental offers advanced compact MBR systems for high-efficiency wastewater treatment and robust DAF systems for industrial pretreatment and solids removal.
Plant Capacity (m³/day)
MBR System Capex (R/m³/day)
MBR Total Capex (R)
DAF System Capex (R/m³/day)
DAF Total Capex (R)
Conventional System Capex (R/m³/day)
Conventional Total Capex (R)
10
R25,000 – R30,000
R250,000 – R300,000
R12,000 – R15,000
R120,000 – R150,000
R15,000 – R18,000
R150,000 – R180,000
50
R22,000 – R27,000
R1,100,000 – R1,350,000
R10,000 – R13,000
R500,000 – R650,000
R13,000 – R16,000
R650,000 – R800,000
200
R20,000 – R25,000
R4,000,000 – R5,000,000
R8,000 – R11,000
R1,600,000 – R2,200,000
R12,000 – R15,000
R2,400,000 – R3,000,000
1,000
R18,000 – R22,000
R18,000,000 – R22,000,000
R7,000 – R10,000
R7,000,000 – R10,000,000
R10,000 – R13,000
R10,000,000 – R13,000,000
10,000
R15,000 – R20,000
R150,000,000 – R200,000,000
R6,000 – R9,000
R60,000,000 – R90,000,000
R8,000 – R11,000
R80,000,000 – R110,000,000
Note: DAF system costs are typically for pretreatment or specific industrial solids removal, not full biological treatment. Costs are estimates and can vary based on site-specific conditions, scope, and supplier. (Zhongsheng Environmental field data, 2025)
Operational Costs: Energy, Chemicals, Labor, and Maintenance
Operational expenses (Opex) are ongoing costs critical for the sustained functioning of a wastewater treatment plant and significantly influence the total cost of ownership. These costs are primarily driven by energy consumption, chemical usage, labor, and routine maintenance. For a 1,000 m³/day plant, annual opex can range from R1.28 million for an MBR system (at R3.50/m³) to R912,500 for a conventional system (at R2.50/m³), highlighting the substantial long-term financial commitment.
Energy is often the single largest operational cost component, particularly for advanced treatment technologies. MBR systems, due to the energy-intensive membrane aeration and filtration processes, typically consume 0.8–1.2 kWh per cubic meter of treated water. In contrast, conventional activated sludge plants, with less intensive aeration requirements and no membrane filtration, operate at a lower energy demand of 0.3–0.5 kWh/m³. With Eskom's 2025 tariffs ranging from R1.80–R2.50/kWh, these differences translate into significant annual energy bills.
Chemical costs also contribute substantially to opex, varying based on influent quality, desired effluent standards, and chosen treatment processes. Coagulants (e.g., ferric chloride, aluminium sulphate) are priced at R20–R50/kg, flocculants at R30–R80/kg, and disinfectants (e.g., chlorine dioxide) at R15–R40/kg. Typical dosage rates include 50–200 mg/L for coagulants in clarification processes and 1–5 mg/L for chlorine dioxide in disinfection, with automated chemical dosing to reduce operational costs and ensure optimal performance. Zhongsheng Environmental also provides efficient chlorine dioxide generators for reliable disinfection.
Labor costs are a fixed component of opex, influenced by the complexity of the plant and the level of automation. Conventional plants generally require fewer operators per unit capacity, with approximately one operator per 5,000 m³/day. MBR systems, while often more automated, necessitate more skilled labor for membrane cleaning and maintenance, typically requiring one operator per 2,000 m³/day. Annual salaries for qualified wastewater treatment plant operators in South Africa range from R250,000–R450,000, reflecting the specialized nature of the role. Maintenance, including spare parts, scheduled servicing, and unforeseen repairs, typically accounts for 5–10% of the total annual opex.
Opex Component
MBR System (R/m³)
MBR Annual Cost (1,000 m³/day)
DAF System (R/m³)
DAF Annual Cost (1,000 m³/day)
Conventional System (R/m³)
Conventional Annual Cost (1,000 m³/day)
Energy
R1.44 – R3.00
R525,600 – R1,095,000
R0.90 – R1.50
R328,500 – R547,500
R0.54 – R1.25
R197,100 – R456,250
Chemicals
R0.50 – R1.50
R182,500 – R547,500
R0.80 – R2.00
R292,000 – R730,000
R0.30 – R1.00
R109,500 – R365,000
Labor
R0.80 – R1.50
R292,000 – R547,500
R0.40 – R0.80
R146,000 – R292,000
R0.25 – R0.75
R91,250 – R273,750
Maintenance
R0.30 – R0.50
R109,500 – R182,500
R0.20 – R0.40
R73,000 – R146,000
R0.20 – R0.40
R73,000 – R146,000
Total Opex (R/m³)
R3.04 – R6.50
R1,109,600 – R2,372,500
R2.30 – R4.70
R839,500 – R1,715,500
R1.29 – R3.40
R470,850 – R1,241,000
Note: Energy costs calculated based on 0.8-1.2 kWh/m³ for MBR, 0.5-0.8 kWh/m³ for DAF (as pretreatment), and 0.3-0.5 kWh/m³ for Conventional, at R1.80-R2.50/kWh (Eskom tariffs, 2025). Labor for 1,000 m³/day plant: MBR requires 1-2 operators; DAF 1 operator (often shared); Conventional 1 operator. (Zhongsheng Environmental field data, 2025)
Compliance Costs: Permits, Discharge Fees, and Environmental Monitoring
wastewater treatment plant cost in south africa - Compliance Costs: Permits, Discharge Fees, and Environmental Monitoring
Compliance costs are often underestimated but can add 15–25% to the total project cost of a wastewater treatment plant in South Africa. These expenses are mandatory for legal operation and include various permits, ongoing discharge fees, and continuous environmental monitoring. Failure to comply can result in significant fines, operational shutdowns, and reputational damage.
The National Environmental Management Act (NEMA) mandates environmental authorizations for new or expanding wastewater treatment facilities. NEMA environmental permits, including application fees and the cost of conducting comprehensive Environmental Impact Assessment (EIA) studies, typically range from R50,000 to R200,000. The timeline for obtaining these permits can be extensive, often taking 6 to 18 months, which must be factored into project planning.
The Department of Water and Sanitation (DWS) issues water use licenses, including those for effluent discharge. These DWS discharge licenses involve a one-time application fee of R10,000–R50,000, followed by annual fees that are volume-based, ranging from R1.20–R3.50 per cubic meter of discharged effluent. These annual fees can accumulate to a substantial amount for larger plants, forming a significant portion of the operational budget. In addition to national regulations, municipal bylaws impose varying charges and standards. For instance, Cape Town charges approximately R2.10/m³ for wastewater discharge, while Johannesburg's rate is around R1.50/m³, highlighting regional discrepancies that necessitate local research.
Ongoing environmental monitoring is another crucial compliance cost. This involves regular sampling and laboratory analysis of treated effluent to ensure adherence to discharge limits. Annual monitoring costs, covering lab testing for parameters such as Chemical Oxygen Demand (COD), Total Suspended Solids (TSS), pH, and heavy metals, can range from R50,000–R200,000. The frequency of testing varies depending on the permit conditions, with parameters like COD often requiring daily checks, while heavy metals might be monitored weekly or monthly.
Compliance Cost Category
Type of Cost
Estimated Cost (R)
Frequency / Notes
NEMA Environmental Permits
Application Fees + EIA Studies
R50,000 – R200,000
One-time (initial project); 6-18 month timeline
DWS Discharge Licenses
Application Fees
R10,000 – R50,000
One-time (initial license)
Annual Discharge Fees
R1.20 – R3.50 per m³ discharged
Annual, volume-based
Municipal Bylaws
Discharge Fees (e.g., Cape Town)
R2.10 per m³
Annual, volume-based (city-dependent)
Discharge Fees (e.g., Johannesburg)
R1.50 per m³
Annual, volume-based (city-dependent)
Environmental Monitoring
Lab Testing (COD, TSS, pH, Metals)
R50,000 – R200,000
Annual, depending on required test frequency (e.g., daily COD, weekly metals)
Note: Costs are estimates and can vary based on project complexity, location, and regulatory updates. (DWS 2024 report, NEMA guidelines, municipal tariff schedules 2025)
MBR vs. DAF vs. Conventional: Which Technology Offers the Best ROI?
Selecting the optimal wastewater treatment technology involves a critical evaluation of capital expenditure, operational costs, land footprint, and the required effluent quality. Each technology—Membrane Bioreactor (MBR), Dissolved Air Flotation (DAF), and Conventional Activated Sludge—presents distinct advantages and disadvantages that influence its suitability and return on investment (ROI) for specific applications.
MBR systems represent advanced biological treatment, capable of producing exceptionally high-quality effluent suitable for reuse, often meeting stringent discharge standards without tertiary filtration. This superior performance comes at a higher capital cost, typically R20,000–R30,000 per m³/day capacity, and elevated operational costs of R3.50–R5.00/m³, largely due to energy-intensive membrane aeration and cleaning. However, MBR's compact footprint (0.1–0.3 m²/m³/day) makes it ideal for sites with limited land availability, and its high effluent quality (95–99% COD/TSS removal) can generate significant savings through water reuse or avoided discharge penalties. For detailed MBR system specifications and selection criteria, further resources are available.
DAF systems are primarily physical-chemical treatment processes, highly effective for removing suspended solids, fats, oils, and grease (FOG), and some heavy metals. They are typically employed as pretreatment for industrial wastewater or as a clarification step in municipal plants. Their capital cost is generally lower, ranging from R10,000–R15,000 per m³/day capacity, with operational costs between R2.00–R3.50/m³. DAF systems offer a moderate footprint (0.2–0.5 m²/m³/day) and achieve excellent TSS removal (80–90%), making them a cost-effective solution when high-quality primary clarification or specific industrial pollutant removal is the main objective. More information on DAF system design parameters and cost benchmarks can guide selection.
Conventional activated sludge systems are the most widely used biological treatment method globally, offering a robust and proven solution for municipal and industrial wastewater. They have the lowest capital cost among the three, at R12,000–R18,000 per m³/day capacity, and moderate operational costs of R2.50–R4.00/m³. However, conventional systems require the largest land footprint (0.5–1.0 m²/m³/day) and typically achieve 85–92% COD removal, which may necessitate further tertiary treatment for stringent discharge or reuse applications.
A decision tree can help guide technology selection:
If footprint is limited and effluent reuse is required (e.g., for irrigation or cooling towers), then MBR is often the best choice.
If budget is tight and land is readily available, with less stringent effluent quality requirements for discharge, then a conventional activated sludge system may be most cost-effective.
If high TSS removal or FOG removal is needed for industrial pretreatment before biological treatment, or to meet specific discharge parameters, then a DAF system provides excellent value.
Metric
MBR System
DAF System
Conventional Activated Sludge
Capex (R/m³/day)
R20,000 – R30,000
R10,000 – R15,000
R12,000 – R18,000
Opex (R/m³)
R3.50 – R5.00
R2.00 – R3.50
R2.50 – R4.00
Footprint (m²/m³/day)
0.1 – 0.3
0.2 – 0.5
0.5 – 1.0
Effluent Quality (COD/TSS removal %)
95 – 99%
80 – 90% TSS (Pretreatment)
85 – 92%
Key Advantages
High effluent quality, compact, water reuse potential
Note: DAF is typically a physical-chemical pretreatment or primary treatment step, not a full biological treatment system like MBR or Conventional. Costs are indicative and vary by project specifics. (Zhongsheng Environmental field data, 2025)
ROI Calculator: How to Justify Your Wastewater Treatment Investment
wastewater treatment plant cost in south africa - ROI Calculator: How to Justify Your Wastewater Treatment Investment
Justifying an investment in a wastewater treatment plant requires a clear understanding of its return on investment (ROI) and payback period. For industrial facilities, this justification often stems from tangible financial savings and avoided costs. Municipal projects, while also seeking efficiency, often factor in broader public health and environmental benefits.
A systematic ROI framework helps to quantify these benefits:
Estimate Capital Expenditure (Capex): Utilize the detailed capex tables provided earlier in this guide, based on your plant’s capacity and chosen technology. This forms the initial investment.
Estimate Operational Expenditure (Opex): Use the opex breakdown (energy, chemicals, labor, maintenance) to calculate the annual running costs of your proposed system.
Calculate Annual Savings and Revenue: Identify all potential financial benefits. This includes:
Water Reuse Savings: If treated effluent replaces potable water, calculate the value of the potable water saved (e.g., R20–R40/m³ for industrial use).
Discharge Fee Avoidance: Quantify the reduction or elimination of municipal or DWS effluent discharge fees (e.g., R1.20–R3.50/m³).
Regulatory Fines Avoided: Estimate the potential costs of non-compliance, which can be substantial.
Sludge Valorization: For some industries, treated sludge can be used for biogas production or as fertilizer, creating a revenue stream.
Calculate Payback Period: The simplest measure of ROI, calculated as: Capex / (Gross Annual Savings – Annual Opex). This indicates how many years it will take for the accumulated savings to offset the initial investment.
Consider a real-world example: A 1,000 m³/day MBR system for a textile factory in Durban.
Estimated Capex: R20 million (from the Capex table).
Estimated Annual Opex: R1.28 million (from the Opex table, assuming R3.50/m³).
Estimated Annual Savings: The factory avoids R2.10/m³ in municipal discharge fees (R2.10 * 1,000 m³/day * 365 days = R766,500/year). Additionally, reusing 80% of the treated water at a cost of R30/m³ for potable water saves R30 * 800 m³/day * 365 days = R8,760,000/year.
Total Gross Annual Savings: R766,500 + R8,760,000 = R9,526,500.
Net Annual Savings (after Opex): R9,526,500 - R1,280,000 = R8,246,500.
Payback Period: R20,000,000 / R8,246,500 ≈ 2.4 years.
This example demonstrates a rapid payback due to significant water reuse. Industrial projects, particularly those facing high discharge costs or needing process water, often achieve payback periods of 3–7 years. Municipal projects, while offering substantial public health and environmental benefits, typically have longer payback periods of 10–20 years, as their justification extends beyond immediate financial returns. To assist in your calculations, a downloadable Excel ROI calculator template with pre-filled formulas for capex, opex, and savings is available to help you model your specific project. For a broader perspective on costs, you can also explore how wastewater treatment costs compare in other regions.
Frequently Asked Questions
Q: How much does a small wastewater treatment plant cost in South Africa?
A: Small wastewater treatment plants in South Africa, treating 10–50 m³/day, typically cost R500,000–R1.5 million for compact MBR systems, or R300,000–R800,000 for conventional activated sludge systems. For residential applications, small septic tank alternatives for an 8-person household start at approximately R150,000, excluding installation costs.
Q: How many wastewater treatment plants are there in South Africa?
A: As of 2025, there are approximately 1,150 municipal wastewater treatment plants operating across South Africa, according to the DWS 2024 report. The estimated number of industrial wastewater treatment plants is around 2,500. Notably, only about 60% of municipal plants currently meet the prescribed effluent discharge standards.
Q: Do wastewater treatment plants make money?
A: Municipal wastewater treatment plants are generally operated as cost centers, funded by municipal rates and tariffs for public health and environmental protection. However, industrial wastewater treatment plants can generate significant financial returns. This is primarily achieved through water reuse (e.g., for irrigation, cooling towers, or non-potable process water) and, in some cases, through sludge valorization (e.g., biogas production, fertilizer). Payback periods for industrial plants typically range from 3–7 years, while municipal projects are justified by broader societal benefits over 10–20 years.
Q: What is the cost of wastewater treatment per cubic meter in South Africa?
A: The operational cost of wastewater treatment per cubic meter in South Africa ranges from R2.00–R5.00, depending on the treatment technology, plant size, and influent characteristics. Municipal plants typically average R2.50–R3.50/m³, while industrial plants, such as those in food processing or textiles, may experience higher costs of R4.00–R5.00/m³ due to higher pollutant loads and more intensive chemical usage.
Q: What are the biggest cost drivers for wastewater treatment plants in South Africa?
A: The top three biggest cost drivers for wastewater treatment plants in South Africa are: 1) Energy, which accounts for 30–40% of operational expenses, particularly for advanced systems like MBR; 2) Compliance costs, including NEMA permits, DWS discharge fees, and ongoing environmental monitoring, which can add 15–25% to total project costs; and 3) Labor, representing 20–30% of operational expenses, with MBR systems often requiring more skilled operators due to membrane maintenance.
Zhongsheng Engineering Team
Our team of wastewater treatment engineers has over 15 years of experience designing and manufacturing DAF systems, MBR bioreactors, and packaged treatment plants for clients in 30+ countries worldwide.