PAC dosing system engineering specifications set pump flow at 1.5–150 ml/hr for peristaltic units or 0.1–10 L/hr for diaphragm units. Storage tanks of 50–5,000 L are sized for 1–7 days. Automation runs from manual set points to PLC flow-paced control. Potable-service wetted parts should meet NSF/ANSI 61, which governs drinking-water contact materials.
Earlier guidance often cited AWWA B604-18 for PAC quality; that standard covers granular activated carbon. Powdered activated carbon purchase requirements fall under ANSI/AWWA B600.
PAC Dosing System Engineering Specifications
PAC dosing system engineering specifications fix pump range, storage volume, and control mode before a skid is bought. Peristaltic units cover 1.5–150 ml/hr, and diaphragm units cover 0.1–10 L/hr. Tanks of 50–5,000 L hold 1–7 days of chemical. Potable-service wetted parts should meet NSF/ANSI 61, and dry feed packages often cost about 30% less than wet slurry plants.
Why PAC Dosing Systems Fail in Operating Plants
Inconsistent PAC delivery is a leading cause of taste and odor (T&O) complaints in municipal plants, usually from mechanical faults or undersized tanks. Industry-reported data attribute roughly 60% of PAC dosing failures to wrong pump selection or inadequate tank sizing, which drives slurry stratification or clogging. Powdered activated carbon is abrasive and bridges in hoppers, so delivery can stop without a clear alarm.
Most plants we size for seasonal T&O run near the low end of the dosage band until a spike hits, then operators need reliable turndown. A Midwest municipal plant over-dosed PAC by 40% for six months after manual mixing errors and no flow-paced control. That error raised annual chemical spend by more than $120,000 and loaded the clarifiers with extra solids. A wastewater site lost the train when standard diaphragm pumps faced a 10% PAC slurry and eroded valve seats within weeks.
Operators should treat a silent hopper as a process alarm, not as a stable dose. Most plants we size for seasonal taste and odor see the failure on the day the raw-water odor number jumps, which is too late to rebuild a feeder. A 10% PAC slurry will sandblast a soft seat; that is why the wastewater train lost its valve seats within weeks.
Common failure modes include:
- Slurry Settlement: Mixing energy below 0.5 W/L lets PAC settle in the preparation tank and produce slug doses.
- Abrasive Wear: Standard centrifugal pumps wear out fast; use detailed pump specifications for PAC dosing systems with hardened seats or hose-only contact.
- Dust Contamination: Poorly sealed dry feeders create respiratory hazards and foul nearby electronics.
- Inaccurate Metering: Missing real-time calibration can push dosage error to ±15%, well above the ±2% band needed for stable TOC removal.
Industrial sites that also run scrubber circuits sometimes confuse boiler-room packages with pac for egcs dosing. Those duty points and materials differ from potable or clarifier-feed PAC skids.
PAC Dosing System Components and Engineering Parameters
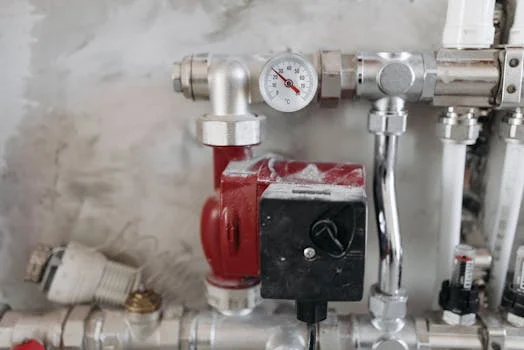
A reliable PAC dosing package has four subsystems: powder storage and feeding, preparation or slurry tanks, metering pumps, and the control layer. Each subsystem must be sized for continuous duty. PLC-controlled PAC dosing skids for precise, automated injection typically use electromagnetic or motor-driven pumps rated for abrasive slurry service.
Most plants we size for a weekend chemical delivery hold closer to 3 days than to 7 days, because moist PAC bridges in a long-idle hopper. The 1–7 day band is still the design window. Pick the short end when the supplier delivers twice a week, and the long end when the site is remote.
Slurry Preparation and Storage Tanks
Preparation tanks must wet carbon particles completely. HDPE or 316L stainless steel resists mild corrosivity and abrasion. Agitators should deliver 0.5–1.5 W/L of tank volume to keep a uniform suspension. Wet systems usually retain slurry 10–30 minutes for hydration before injection.
| Plant Capacity (m³/h) | Recommended Tank Size (L) | Agitator Power (kW) | Typical PAC Dosage (mg/L) |
|---|---|---|---|
| 10–50 | 200–500 | 0.18–0.37 | 2–15 |
| 51–150 | 500–1,500 | 0.37–0.75 | 5–20 |
| 151–500 | 2,000–5,000 | 1.1–2.2 | 10–30 |
Most plants we size for the middle row of that table keep the agitator running. Mixing energy below 0.5 W/L lets PAC settle in the preparation tank and send a slug dose.
PAC Dosing Pump Specifications Peristaltic Diaphragm
Peristaltic PAC pumps suit low-pressure duties up to about 1.5 bar because slurry contacts only the hose interior. Diaphragm pumps handle inline injection up to about 10 bar when valve seats are ceramic or tungsten carbide.
Target accuracy of ±1% of set point keeps chemical use aligned with engineering parameters for PAC and other treatment chemicals. API 675 is the usual industrial reference when a buyer wants that steady-state band on abrasive slurry. Municipal specifications do not always call that standard out.
That document is a different duty from the hose and diaphragm choices above. Most plants we size for a 5–10% PAC slurry stay with a hose or a hardened diaphragm unless the vendor proves wear life on carbon.
Automation and PLC Logic
Modern skids use PLC control with Modbus or SCADA links. Flow-paced dosing should scale PAC feed from a 4–20 mA influent flow signal. Fail-safes include low-level alarms, pump-run confirmation from flow sensors, and shut-off valves that stop siphoning after a stop. Broader chemical dosing system design covers coagulant and disinfectant packages, while PAC duty still needs its own abrasion and dust checks.
Dry vs Wet PAC Dosing: Design, Cost, and Performance
Dry PAC systems meter powder with a volumetric or gravimetric feeder into a carrier-water stream. Wet systems make a 5–10% slurry in a batch tank before injection. Dry packages respond in 5–10 minutes for emergency T&O control and often cost about 30% less in capital because they omit large mix tanks.
The comparison table lists that dry response as rapid (5–15 mins), which is 5–15 minutes from a cold start. Wet dosing remains common above about 100 m³/h, where slurry mixing improves particle distribution for TOC removal.
According to AWWA 2023 benchmarks cited in plant comparisons, dry PAC trains often reach 90–95% TOC removal efficacy, while wet trains range 85–92%. Wet layouts create less dust than open dry feeders.
Most plants we size for flows under about 100 m³/h start with a dry feeder unless the building cannot tolerate dust. Above that flow, a wet train is the layout we see most often, because the 5–10% slurry is easier to spread across a wide basin.
| Feature | Dry PAC Dosing | Wet PAC Dosing |
|---|---|---|
| Capital Cost (CAPEX) | $15,000 – $60,000 | $50,000 – $250,000 |
| Response Time | Rapid (5–15 mins) | Slow (30–60 mins) |
| Footprint | Small / Compact | Large (Requires Tanks) |
| Maintenance | High (Feeder Clogging) | Moderate (Pump Wear) |
| Automation Complexity | Low to Moderate | High (Batch Logic) |
Dry feeders need dust collection, moisture control, and sealed multi-screw feeders to limit bridging and dust. Wet trains spend energy on continuous agitation and more batch labor unless fully automated. Food-plant SBR trains that dose carbon for organics spikes should review pac dosing for sbr tank layouts separately from municipal raw-water PAC skids.
How to Size a PAC Dosing System
Sizing a PAC dosing system starts from peak dosage and plant hydraulics, then checks pump pressure and storage days before equipment is locked. Use jar-test data before the pump curve or the storage days are frozen.
PAC Slurry Preparation Tank Sizing Calculation
The PAC slurry preparation tank sizing calculation at 200 m³/h and 15 mg/L is 216 kg for 3 days, and a 500 L tank or a 250 kg hopper usually covers it. Run the steps below in order so the tank, the hopper, and the pump share one feed rate.
Step 1: Determine PAC Dosage Rate (mg/L). Typical bands are 2–20 mg/L for seasonal taste and odor control and 5–50 mg/L for industrial organics removal.
Step 2: Calculate PAC Feed Rate (kg/hr). Feed Rate (kg/hr) = Plant Flow (m³/h) × Dosage (mg/L) × 10⁻³. Example at 200 m³/h and 15 mg/L: 200 × 15 × 0.001 = 3 kg/hr of PAC.
Step 3: Size the Storage Hopper or Tank. Capacity (kg) = Feed Rate (kg/hr) × 24 × Desired Days of Storage. At 3 kg/hr for 3 days: 3 × 24 × 3 = 216 kg. A 500 L tank or 250 kg hopper usually covers that duty.
Step 4: Determine Pump Capacity (L/hr). For a 10% slurry at 0.1 kg/L, Pump Flow (L/hr) = PAC Feed Rate (kg/hr) / Slurry Concentration (kg/L). Example: 3 / 0.1 = 30 L/hr pump capacity.
Step 5: Verify System Pressure and NPSH. Pump pressure must exceed injection backpressure (about 1.5–3.0 bar into open tanks; higher for pressurized pipe). Check NPSH on viscous 10% slurries to avoid cavitation.
Read the 0.001 factor as 10⁻³. Milligrams per liter times cubic meters per hour, multiplied by 10⁻³, gives kilograms per hour. Most plants we size for the 200 m³/h example treat 3 kg/hr as the average day. They still select the pump at 30 L/hr so a dose spike does not force a second skid.
Which design criteria matter most for selection?
Design criteria for a PAC package hinge on peak mg/L dose, available contact time, and solids load sent to clarification. Overflow rate and sludge handling on the clarifier set how much PAC solids the plant can absorb before sludge pumps or lamella packs are overloaded. Match feeder accuracy and pump turndown to the widest seasonal swing, not the average day.
How do type and solids loading change the skid?
Type selection, dry feeder versus wet slurry, follows response time and footprint more than brand preference. High solids loading from 20–50 mg/L PAC doses needs larger slurry tanks, flush cycles, and downstream sludge capacity. Circular or rectangular primary clarifiers both work if sludge withdrawal keeps up; DAF or lamella stages may need higher PAC-compatible sludge solids handling when doses rise.
PAC Dosing System Costs and ROI Benchmarks
Total cost of ownership for a PAC dosing system splits into CAPEX and OPEX. A fully automated, containerized package for a 100–500 m³/h municipal plant typically ranges from $150,000 to $400,000. Smaller industrial skids can start near $20,000 for manual layouts.
Chemical spend dominates OPEX. PAC prices often fall between $1.50 and $3.50 per kilogram by feedstock and iodine number. Manual labor can add $0.05–$0.10/m³, which PLC automation cuts. Many plants pair PAC with complementary disinfection systems for PAC-treated water to limit disinfection by-product formation after organics are adsorbed.
Chemical price still dominates the skid price. At $1.50 to $3.50 per kilogram, a plant feeding 3 kg/hr spends more on PAC in a year than on hose replacements. Most plants we size for that 3 kg/hr duty check the iodine number on each lot, because a weak number forces a higher mg/L dose.
| Cost Component | Manual System (Small) | Automated Skid (Medium) | Containerized System (Large) |
|---|---|---|---|
| Equipment CAPEX | $15k – $40k | $60k – $180k | $200k – $500k |
| Installation | $5k – $10k | $20k – $50k | $50k – $100k |
| Annual Maintenance | $2k – $4k | $5k – $12k | $15k – $30k |
| Est. Payback (Years) | 1.5 – 2.0 | 2.0 – 3.5 | 3.0 – 5.0 |
ROI example: a 250 m³/h facility moving from GAC contactors to PAC can save about $0.15 per m³ in media and energy. At 2.1 million m³/year, $315,000 annual savings can repay a $300,000 automated skid in under 12 months when jar tests confirm the dose band.
PAC Dosing System Selection Guide for Engineers
A PAC dosing system selection guide for engineers ranks peak mg/L dose, pump turndown, and slurry-wear materials ahead of brand preference. Procurement teams should lock the ten points below before award, because vague answers here usually become commissioning delays. Most plants we size for seasonal swings ask whether turndown is 10:1 or 100:1 before they discuss cabinet color.
- Dosage Range: What minimum and maximum PAC dosage (mg/L) does the skid hold at our peak flow?
- Slurry Concentration: What maximum slurry percentage can the pumps run without rapid wear (typical band 5–10%)?
- Pump Turndown Ratio: Is turndown 10:1 or 100:1 for seasonal water-quality swings?
- Materials Compliance: Are all wetted parts certified to NSF/ANSI 61 for drinking-water service?
- Dust Control: Does the dry feeder include a bag-dump station with HEPA filtration?
- Feeder Accuracy: Is the feeder volumetric or gravimetric, and what certified accuracy applies (for example ±2%)?
- Control Integration: Does the PLC speak EtherNet/IP, Modbus TCP, or Profibus on our plant network?
- Maintenance Intervals: What hose or diaphragm life is expected on PAC slurry?
- Lead Time: What is the current lead time for a factory-tested skid?
- Support: Will the vendor run on-site jar tests to pick the PAC grade?
Who This Is For / Next Step
Plant engineers and EPC teams use this page when they size PAC feed for taste and odor, TOC, or short-term organics spikes. Look elsewhere if the duty is continuous PFAS compliance under a designated best available technology, or if the only need is coagulant make-down. According to a US EPA news release on May 18, 2026, the proven separation technologies named were granular activated carbon, ion exchange resins, and high-pressure membranes such as reverse osmosis. The same release said proposed rules would uphold the PFOA and PFOS drinking-water standards.
For a duty-matched Automatic Chemical Dosing System review, share flow, dose band, and injection pressure on the request-quote form. Most plants we size for this duty send the peak flow, the dose band, and the injection pressure together.
Frequently Asked Questions
What is the difference between PAC and ACH in water treatment?
PAC (powdered activated carbon) is an adsorbent for organics, tastes, and odors. ACH (aluminum chlorohydrate) is a coagulant that destabilizes colloids for turbidity removal. The two chemicals do different jobs and are not interchangeable, so a PAC slurry skid cannot replace an ACH feed. Plants often run both, but each needs its own pump, tank, and control logic.
What is the API standard for dosing pumps in these systems?
API 675 is the common reference for controlled-volume positive displacement pumps. It sets expectations for accuracy, repeatability, and linearity across the turndown range. Municipal water projects do not always mandate API 675, yet high-spec industrial wastewater packages often require it. Meeting API 675 helps hold about ±1% steady-state accuracy when PAC slurry duty is abrasive and variable.
How do I prevent PAC from clogging the dosing lines?
Keep a scouring velocity of about 0.6–1.0 m/s in the discharge piping. Add an automated clean-water flush whenever the dosing pump stops so settled carbon does not set up in the line. Transparent PVC or sight-flow fittings help operators spot build-up early. Hardened seats and a 5–10% slurry concentration further cut blockage risk on wet systems.
Can a PAC dosing system be used for PFAS removal?
PAC can reduce some PFAS in the short term, especially longer-chain PFOA and PFOS, but results vary with carbon grade, particle size, and background organics. Earlier guidance treated PAC as a flexible interim option at roughly 20–50 mg/L with 30+ minutes of contact. According to US EPA (2024), best available technologies for the PFAS NPDWR are granular activated carbon, anion exchange, reverse osmosis, and nanofiltration. PAC was not selected as a BAT because removal efficacy is variable.
What PFAS limits does the 2024 drinking-water rule set?
According to the US EPA final rule published on April 26, 2024 (89 FR 32532), the PFOA and PFOS maximum contaminant levels are 4.0 ng/L each. PFHxS, PFNA, and HFPO-DA each have an MCL of 10 ng/L, and a Hazard Index of 1 applies to mixtures that include those three plus PFBS. Initial monitoring is due by April 26, 2027, and MCL compliance is due by April 26, 2029. PAC is not the compliance technology for those MCLs.