A digital twin for a wastewater treatment plant (WWTP) mirrors hydraulic and biological behavior with live SCADA and sensor feeds. Plants use it to forecast load swings, trim aeration and chemical dose, and flag equipment risk hours ahead of an alarm.
What Is a Digital Twin for Wastewater Treatment Plants?
A WWTP virtual plant model is a continuously updated, physics-based replica fed by SCADA, IoT sensors, and process simulation. It predicts influent and equipment states, tests control moves before they hit the plant, and supports strategic, tactical, and real-time decisions. Typical refresh targets stay under 30 seconds for operational control loops when edge hardware is available.
Core building blocks usually include:
- IoT sensors: Dissolved oxygen (DO), pH, total suspended solids (TSS), flow, and nutrient sensors at critical process points.
- SCADA integration: Live tags from the existing supervisory system into the model runtime.
- First-principle models: Hydraulic and biological simulations such as activated sludge kinetics and clarifier settling.
- AI/ML forecasting layers: Models that project influent swings, failure modes, and process upsets from historical plus live data.
SCADA monitors and alerts. The virtual model simulates, predicts, and recommends setpoints. SCADA may flag low DO after it happens; the model can project a DO dip about 4 hours ahead and propose blower moves that keep the basin in band.
Decision support typically falls into three bands used by DHI Group practice:
- Strategic: Capacity and upgrade planning over multi-year horizons, including population-growth scenarios.
- Tactical: Wet-weather and seasonal load management, including storm-event chemical dosing plans.
- Operational: Real-time aeration, recycle, and dosing moves during ammonia or flow spikes.
Engineering Specifications: What Your Plant Needs to Run a Live Process Model
Effective deployment needs clear engineering specs. The following targets reflect 2024 WEF field guidance patterns and vendor commissioning data most plants we size against:
| Parameter | Requirement | Notes |
|---|---|---|
| Sensor Density | 1 sensor per 500 m³ of bioreactor volume (DO, pH, TSS) | Critical for biological process accuracy. Anoxic zones require additional nitrate/nitrite sensors. |
| Data Refresh Rate | SCADA data latency <15 seconds; model refresh <30 seconds | Latency >30 seconds degrades real-time optimization. Edge computing recommended for large plants. |
| Model Accuracy | Hydraulic models: ±5% flow prediction; biological models: ±10% COD/BOD removal | Validated per EPA 2023 protocols. Accuracy degrades without quarterly recalibration. |
| Network Bandwidth | 1 Gbps for plants >50,000 m³/day; 100 Mbps for smaller plants | Cloud-based twins require lower bandwidth than edge deployments. |
| Hardware Prerequisites | Edge computing (for latency-sensitive plants) or cloud infrastructure | Edge devices must support GPU acceleration for real-time simulations. |
Common retrofit friction shows up in three places. Legacy SCADA often needs API wrappers or middleware. Sensor drift needs lab correlation or auto-calibration loops. Lab, weather, and SCADA data still sit in silos until a shared data lake feeds training and validation.
Plants with thin sensor grids often close part of the gap with dynamic chemical dosing systems for real-time optimization, which can offset missing biological signals during turbidity and flow swings.
How Live Process Models Improve WWTP Performance: Measurable KPIs
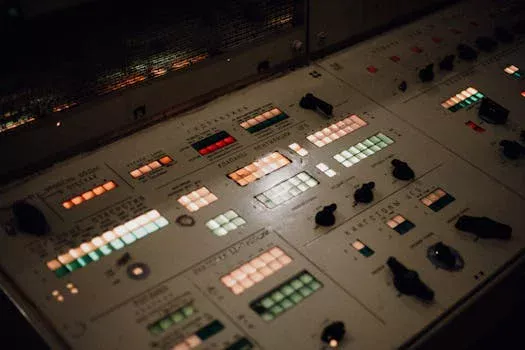
Live process models deliver measurable gains across five KPI bands. Benchmarks below come from EPA 2023 summaries, WEF case notes, and vendor field reports retained from the source article:
| KPI | Improvement Range | Mechanism | Case Study Example |
|---|---|---|---|
| Energy Savings | 12–25% reduction in aeration energy | Real-time DO optimization and blower control | 18% savings at a 30,000 m³/day plant in Germany (2024 WEF report) |
| Compliance Violations | 40% fewer violations | Predictive effluent quality modeling and dynamic control | 0 violations over 18 months at a 50,000 m³/day plant (EPA 2023) |
| Unplanned Downtime | 60% reduction | Predictive maintenance for pumps, blowers, and membranes | 72-hour advance warning for pump failures (Mantis.AI case study) |
| Chemical Costs | 15–30% reduction in coagulants/flocculants | Dynamic dosing based on influent turbidity and flow | 22% savings at a 20,000 m³/day industrial plant (HydropureWater field data, 2025) |
| Sludge Volume | 8–12% reduction | Optimized solids retention time (SRT) control | 10% reduction at a 40,000 m³/day municipal plant (IWA 2024) |
According to DHI (2024), aeration can account for up to 60% of WWTP energy use; blower power cuts of up to 30% can trim overall plant power by up to 20%. That sits inside the 12–25% aeration range above when DO control is the main lever. High-COD sites also pair models with advanced COD reduction techniques so setpoints track real influent swings instead of fixed recipes.
What Opportunities Exist for Water and Wastewater Facilities?
A digital twin pays back fastest when aeration energy, wet-weather compliance, and unplanned downtime dominate OPEX. Strategic uses include capacity studies before concrete is poured. Tactical uses cover storm dosing and seasonal SRT shifts. Operational uses cover DO, recycle, and chemical moves within a shift.
According to ORNL (2026), paired physical and virtual systems can refresh operating settings at least hourly against energy prices, which helps utilities shift load without waiting for a next-day report. Most plants we size for municipal BNR run the first pilot on one aeration train, not the whole site, so operators learn the workflow before full rollout.
Hardness and scaling swings still distort chemical dose models. Pairing live water-quality tags with an Industrial Water Softener System (KJ-WT Series) keeps feed chemistry steadier for the control layer.
Cost Breakdown: CAPEX, OPEX, and ROI Models
Cost ranges below summarize 50+ WWTP deployments reported for 2023–2025. Treat them as planning bands, not a fixed bid:
| Cost Category | Range (USD) | Notes |
|---|---|---|
| CAPEX | ||
| Software (licensing and development) | $50,000–$200,000 | Custom models for industrial plants cost 2–3x more than municipal. |
| Sensors and IoT devices | $20,000–$100,000 | Includes DO, pH, TSS, flow, and nutrient sensors. Retrofits may require additional wiring. |
| Edge computing hardware | $15,000–$50,000 | GPU-accelerated servers for real-time simulations. Cloud deployments reduce this cost. |
| Integration and commissioning | $30,000–$80,000 | SCADA integration, model calibration, and operator training. |
| Total CAPEX | $115,000–$430,000 | |
| OPEX (Annual) | ||
| Software licensing | $10,000–$40,000 | Subscription or perpetual licensing models available. |
| Cloud hosting | $5,000–$20,000 | Edge deployments eliminate this cost but require on-site IT support. |
| Maintenance and updates | $15,000–$30,000 | Includes model recalibration, sensor maintenance, and software updates. |
| Training and support | $5,000–$15,000 | Operator training, refresher courses, and vendor support contracts. |
| Total OPEX | $35,000–$105,000 | |
| Cost per m³ Treated | $0.02–$0.08/m³ | Smaller plants (<10,000 m³/day) pay more per m³ due to fixed costs. |
| ROI Payback Period | 1.5–3.5 years | Faster for energy-intensive plants (e.g., aeration-heavy systems). |
Calculate ROI with this relationship:
ROI = (Annual Savings from Energy + Chemicals + Compliance + Downtime) / (CAPEX + Annual OPEX)
Example: A 30,000 m³/day plant saves $200,000/year in energy, $50,000 in chemicals, and $30,000 in compliance penalties, with CAPEX of $300,000 and OPEX of $50,000/year. Payback is ($200,000 + $50,000 + $30,000) / ($300,000 + $50,000) = 0.77 → about 1.3 years.
Selection checklist before you sign a pilot:
- Baseline kWh/m³, chemical $/m³, violation count, and unplanned downtime hours for the last 12 months.
- Confirm OPC UA or REST paths from SCADA, or budget middleware for legacy tags.
- Count DO/pH/TSS/nutrient sensors per 500 m³ bioreactor volume and list gaps.
- Pick one process unit for a 3–6 month pilot with a written accuracy target (±10% COD/BOD).
- Assign an owner for quarterly recalibration against lab composites.
- Price edge versus cloud latency against your <30 second refresh need.
- Require ISO 27001 or SOC 2 evidence for any cloud path.
How Do Platforms Compare for SCADA Integration?

Platform choice hinges on plant size, process mix, and how clean your SCADA tags are. The anonymous vendor matrix below reflects engineering specs and buyer feedback from 2024–2025:
| Vendor | Model Types | Data Integration | AI/ML Capabilities | Deployment Options | Pricing Model | Best For |
|---|---|---|---|---|---|---|
| Vendor A | Biological, hydraulic, energy | SCADA, IoT, lab data, weather | Predictive maintenance, influent forecasting | Cloud, edge, hybrid | Subscription ($15,000–$40,000/year) | Small to medium plants (<50,000 m³/day) |
| Vendor B | Hydraulic, energy, asset management | SCADA, GIS, CMMS | Asset failure prediction, energy optimization | Cloud, edge | Perpetual license ($100,000–$250,000) | Large municipal systems (>50,000 m³/day) |
| Vendor C | Biological, hydraulic, chemical | SCADA, IoT, lab data | Dynamic chemical dosing, compliance prediction | Cloud | Subscription ($20,000–$50,000/year) | Industrial wastewater (e.g., food & beverage, pharma) |
| Vendor D | Hydraulic, energy, asset management | SCADA, IoT, weather | Energy optimization, wet weather management | Cloud, edge | Subscription ($10,000–$30,000/year) | Municipal and industrial plants |
| Vendor E | Biological, hydraulic, energy | SCADA, IoT, lab data | Predictive maintenance, influent forecasting | Edge, hybrid | Perpetual license ($80,000–$200,000) | Large plants with complex processes |
Run a 3–6 month pilot on one unit before plant-wide spend. Check ISO 27001 and SOC 2 claims for cloud paths. Small plants need modular pricing; large plants need proven edge latency. Ask for 24/7 support SLAs when the model writes setpoints. For plants with existing SCADA, use the complete guide to SCADA integration for digital twins when you scope tag lists and middleware.
How Do You Implement Models at Utility-Scale Facilities?
Utility-scale rollout fails most often on data plumbing, not on the math. Use this six-step sequence:
-
Audit Existing Infrastructure
- Map SCADA, sensor coverage, and bandwidth. Flag missing DO in anoxic zones and high-latency feeds.
- Document baseline energy, violations, and downtime so savings claims stay auditable.
-
Define KPIs and Success Metrics
- Write numeric goals such as “cut aeration energy 20% in 12 months” or “cut violations 30%.”
- Align ops, compliance, and procurement on the same scorecard.
-
Select a Vendor and Pilot One Unit
- Match vendor strengths to plant size and process type using the comparison table.
- Pilot one aeration basin or clarifier for 3–6 months before expansion.
-
Integrate Data Sources and Calibrate
- Connect SCADA, lab, weather, and IoT feeds. Budget 6–12 weeks for legacy systems.
- Calibrate on history plus lab composites; recalibrate each quarter.
-
Train Operators and Wire into Workflows
- Train on alerts, recommended setpoints, and override rules. The tool augments judgment; it does not replace it.
- Fold outputs into shift handover and maintenance planning.
-
Scale and Keep Improving
- Expand to clarifiers, digesters, and sidestreams after the pilot holds accuracy.
- Keep monthly model checks and quarterly operator refreshers on the calendar.
Fast-growing districts should prefer modular licenses and edge capacity that adds trains without a full re-platform. Under-budgeted SCADA work, skipped operator buy-in, and missed seasonal recalibration are the three failure modes we see most often.
Where makeup water hardness drives coagulant swings, stabilizing feed with an Industrial Water Softener System (KJ-WT Series) reduces noise in the dosing model during expansion phases.
Case Study: How a 50,000 m³/day Plant Saved $450,000/Year
A municipal WWTP in the Netherlands serving 200,000 population equivalents (PE) at 50,000 m³/day capacity deployed a live process model to cut energy, violations, and downtime.
Plant profile: Activated sludge with biological nutrient removal (BNR) and tertiary filtration.
Challenges:
- High aeration energy costs ($1.2M/year), about 45% of total OPEX.
- Frequent compliance violations (3–5/year) from wet-weather ammonia spikes.
- Unplanned downtime (120 hours/year) from pump and blower failures.
Solution package:
- Real-time DO control from influent ammonia and flow forecasts.
- Predictive maintenance on pumps and blowers with about 72-hour warnings.
- Effluent quality forecasts about 24 hours ahead to guide dose and SRT.
Results after 18 months:
- Energy: 22% aeration cut, saving $264,000/year.
- Compliance: 0 violations over 18 months, avoiding about $80,000 in potential fines.
- Downtime: 70% cut (36 hours/year), saving $50,000 in emergency repairs.
- Chemicals: 18% coagulant cut, saving $56,000/year.
Total annual savings: $450,000. ROI: 1.8-year payback on $800,000 CAPEX and $100,000/year OPEX.
Lessons from the field: Hands-on workshops unlocked operator adoption. Quarterly lab recalibration moved COD/BOD error from ±12% to ±8%. Edge servers cut model refresh from 45 seconds to 12 seconds, which finally enabled closed-loop aeration moves.
Who This Is For / Next Step
This path fits municipal and industrial plants above about 5,000 m³/day with measurable aeration spend, compliance risk, or chronic pump/blower failures. Plants far below that band, or sites with almost no online sensors and no SCADA upgrade budget, should fix instrumentation first. If you want a scoped pilot against your tag list and KPI baseline, request a process-model readiness review with your current SCADA export and 12-month energy record.
Frequently Asked Questions
How accurate are effluent quality predictions from a live plant model?
Calibrated models typically hold ±10% on COD/BOD removal and ±15% on nutrient (N/P) predictions when recalibrated each quarter. Accuracy slips during seasonal influent shifts if calibration stops. A 2024 WEF study found uncalibrated winter runs overpredicted ammonia removal by 22%, which is why lab composites remain part of the control loop.
Can the model work with my existing SCADA system?
Yes. Modern platforms (Siemens, Rockwell, and peers) usually connect through OPC UA or REST APIs, while legacy systems need middleware or wrappers. Integration commonly takes 6–12 weeks and costs $30,000–$80,000 depending on SCADA age and tag quality. Start with a read-only historian feed before any write-back of setpoints.
What plant size makes the investment cost-effective?
Plants treating more than 5,000 m³/day usually clear the cost bar. Smaller sites struggle with CAPEX of $115,000–$430,000 unless energy or fine risk is already high. A 3,000 m³/day plant spending $300,000/year on aeration can still see about a 3-year payback if it sustains a 15% energy cut.
How much operator training is required?
Initial training usually runs 2–4 weeks, mixing on-site workshops with scenario drills. Vendors often deliver 1–2 days on site, then remote follow-ups. Plants that keep under 10 hours of annual refreshers saw about 40% lower utilization in a 2025 survey, so schedule quarterly refreshers with the recalibration cycle.
What cybersecurity risks come with connecting models to SCADA?
Main risks sit at the SCADA interface and any cloud or edge path that exposes HMIs. Isolate model networks from corporate IT, use VPN or private APN links, enforce role-based access, and require ISO 27001 or SOC 2 from vendors. An EPA report found 85% of WWTP cyber incidents involved unpatched SCADA, so patch discipline matters as much as the model itself.
Related Equipment
The following HydropureWater products address the wastewater challenges discussed:
- MBR systems with built-in sensor integration for digital twin compatibility — view specifications, capacity range, and technical data
Need a customized solution? Request a free quote with your specific flow rate and pollutant parameters.