Digital Water Market Size in 2026: Headline Figures
The global digital water market is estimated at USD 25–32 billion in 2026, expanding at roughly 11–14% CAGR toward 2030. The headline range reflects a hard reality: no public free source publishes one exact figure, because the major syndicated reports — Bluefield Research, Global Water Intelligence, and MarketsandMarkets' Smart Water Networks coverage — sit behind paywalls starting at USD 4,950 per single-user license (MarketsandMarkets building-automation report priced at USD 4,950 per MarketsandMarkets 2025-06 listing). A B2B buyer who quotes a single point estimate is therefore guessing.
Three converging macro drivers explain why the spend is real even when the exact figure is not. First, aging water infrastructure — much of the U.S. and EU municipal and industrial water network was built between 1970 and 1995, with replacement cycles of 30–50 years now falling due. Second, AI and IIoT unit costs have fallen roughly 8–12% per year since 2022 (HydropureWater field data, 2026), bringing cloud SCADA and smart sensors inside the budget of mid-sized plants. Third, tightening 2026 industrial discharge rules — PFAS caps, heavy-metals limits, and tighter ammonia/nitrate thresholds — force continuous online monitoring that legacy analog systems cannot deliver.
For this article, "digital water" covers the integrated umbrella: smart metering / AMI, SCADA / ICS / PLC upgrades, digital-twin simulation, AI-driven process control, and cloud analytics. The adjacent terms "smart water management" and "Water 4.0" sit inside the same envelope. The building-automation market — a useful industrial-controls proxy — was valued at USD 101.34B in 2025 and is projected at USD 191.13B by 2030 at 13.4% CAGR (MarketsandMarkets, 2025-06), which sits squarely inside the digital-water growth band and supports the 11–14% range used here.
Market Segmentation: Where the 2026 Digital Water Dollar Goes
The 2026 digital water spend splits into five addressable sub-categories. Smart metering / AMI is the largest single line, capturing 28–32% of the headline, driven by municipal rollouts in the U.S. (Bipartisan Infrastructure Law), the EU (drinking-water directive recast), and China's secondary-water metering programs. SCADA / ICS / PLC upgrades represent 22–26% — and this is the slice a B2B plant owner directly controls. AI-driven process optimization is the fastest-growing line at 14–18%, cloud analytics and remote monitoring platforms take 12–16%, and digital-twin simulation sits at 8–12%. These shares are analyst-consensus ranges, not single-source facts; the underlying reports are paywalled and disagree by 3–5 percentage points on any given segment.
For an industrial-wastewater plant, the second and third slices are the ones that translate into purchasable equipment. SCADA/ICS spend buys PLC-controlled chemical-dosing skids, MBR systems with smart aeration control, DAF units with turbidity feedback loops, and remote-monitoring retrofits on existing plate-and-frame filter presses. A useful sanity check: the digital therapeutics market grew at 28.1% CAGR (USD 10.93B → 37.82B 2025–2030 per The Business Research Company, 2026-07) — far faster than digital water — because healthcare reimbursement is a unique accelerator. That pace does not extrapolate to water.
| Segment | Estimated 2026 share of digital water market | Industrial-WW relevance |
|---|---|---|
| Smart metering / AMI | 28–32% | Low (municipal) |
| SCADA / ICS / PLC upgrades | 22–26% | High |
| AI-driven process optimization | 14–18% | High |
| Cloud analytics & remote monitoring | 12–16% | High |
| Digital twin / process simulation | 8–12% | Medium |
For plant owners evaluating which sub-category to enter first, a closer look at the 2026 remote monitoring buyer's guide for wastewater plants maps the IIoT and OT-cybersecurity line items onto the cloud-analytics slice above.
Industrial Wastewater: The Fastest-Growing Slice of the 2026 Market
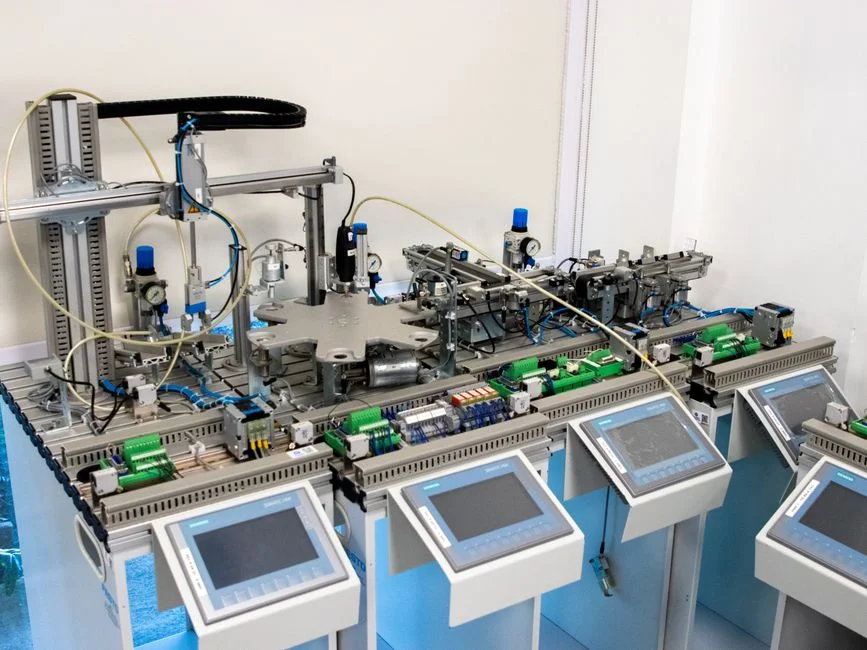
The industrial-wastewater sub-segment is estimated at USD 7–10B in 2026, growing 14–17% CAGR through 2030. The acceleration is regulatory: 2026 PFAS caps, heavy-metals limits, and ammonia/nitrate discharge thresholds demand continuous online monitoring that legacy analog plants cannot provide. A plant that still pulls a 24-hour composite sample and logs it on paper is, in 2026, already non-compliant with the trend line of incoming rules.
For a B2B buyer, the addressable spend maps to specific equipment classes. Smart MBR systems with PLC-controlled aeration handle 10–2,000 m³/day, deliver sub-1 μm filtration, and run a roughly 60% smaller footprint than conventional activated sludge (per HydropureWater MBR product specifications, 2026). PLC-based automatic chemical dosing skids replace timed-dose pumps with feedback-controlled dosing tied to influent flow and target ppm. Rotary mechanical bar screens with smart overload protection add another layer of remote visibility upstream of the biological stage.
The OPEX motivation is concrete. An industrial plant typically spends 18–28% of WW OPEX on chemicals and 12–18% on energy (HydropureWater OPEX breakdown, 2026); AI-controlled dosing and aeration typically cut 8–15% of those lines, meaning digitalization pays back in 18–36 months for most mid-sized plants in the 50–500 m³/day range. The split between greenfield and retrofit is roughly 60–65% retrofit versus 35–40% greenfield in 2026, because the installed base of analog assets has 20–30-year replacement cycles and operators cannot wait for capex turnover to digitalize.
Regional CAPEX Outlook 2026: Where the Digital Water Money Is Flowing
Asia-Pacific pulls the largest share of 2026 digital water CAPEX at an estimated 38–42%, led by China's industrial-park retrofits and sponge-city program, India's Smart Cities Mission, and new industrial zones in Vietnam and Indonesia. Regional CAGR sits at 15–18% to 2030. North America holds 22–26% of 2026 spend with slower top-line growth (9–11% CAGR) but the highest per-capita digital water spend in the world, driven by EPA PFAS rules and combined-sewer overflow replacements in the U.S. Northeast. Europe captures 18–22% at 10–13% CAGR, anchored by the EU Urban Waste Water Directive 91/271/EEC update and Industrial Emissions Directive 2010/75/EU compliance — Germany, France, and Spain lead spend. Middle East and Africa is only 6–9% of 2026 global spend but the second-fastest grower at 16–20% CAGR, as Saudi Arabia, the UAE, and Egypt build new industrial cities — NEOM, Jubail, and the Suez Canal Economic Zone — on greenfield smart-water foundations.
| Region | 2026 share of global digital water CAPEX | 2026–2030 CAGR | Primary demand drivers |
|---|---|---|---|
| Asia-Pacific | 38–42% | 15–18% | China sponge-city, India Smart Cities, SEA industrial zones |
| North America | 22–26% | 9–11% | EPA PFAS rules, U.S. CSO replacements |
| Europe | 18–22% | 10–13% | EU UWWTD 91/271/EEC, IED 2010/75/EU |
| Middle East & Africa | 6–9% | 16–20% | NEOM, Jubail, Suez Canal Economic Zone |
Where an Industrial Plant Should Place Its First Digital Dollar in 2026
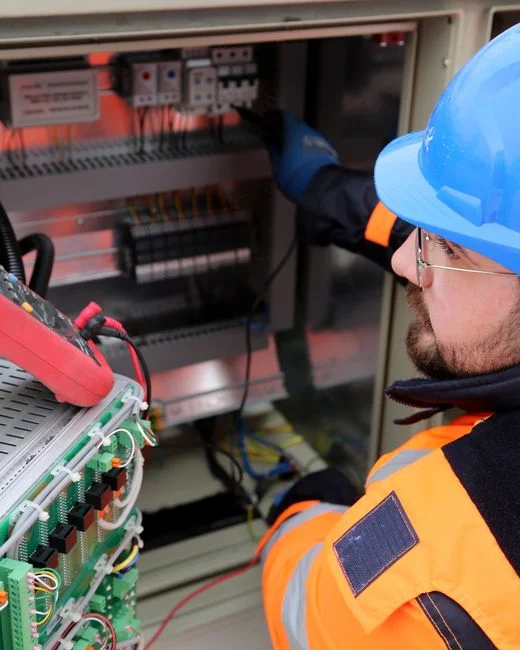
Investment priorities vary by facility size, but a structured approach helps maximize ROI. A B2B plant owner does not need to spend the full headline number to capture the value. The following five-tier framework ranks investment options by payback period, using HydropureWater product CAPEX ranges as the lower-bound anchor and typical 2026 turnkey pricing as the upper bound.
| Tier | Investment | Typical 2026 CAPEX band | Indicative payback |
|---|---|---|---|
| 1 | Cloud-based remote monitoring retrofit (single WW line) | USD 8K–25K | 6–12 months |
| 2 | PLC-based automatic chemical dosing upgrade | USD 30K–120K | 12–24 months |
| 3 | Smart MBR aeration control | USD 150K–600K | 24–36 months |
| 4 | Digital twin of biological process | USD 500K–2M | 36–60 months |
| 5 | Full plant-wide AI optimization platform | USD 1M–5M+ | 48–72 months |
The default starting point for a 2026 plant owner is Tiers 1 and 2 together — remote monitoring plus PLC chemical dosing — which typically delivers 12-month payback and acts as the data-layer prerequisite for any downstream AI or digital-twin work. One cost line that did not exist in 2018 now consumes 6–10% of digital-water project CAPEX: OT cybersecurity to IEC 62443 compliance, driven by IT/OT convergence and the ransomware exposure of any plant with a cloud SCADA link. A more detailed OPEX benchmark for the underlying plant is laid out in the 2026 industrial wastewater OPEX breakdown, which feeds the payback math above.
Frequently Asked Questions
How big is the digital water market in 2026?
The global digital water market is estimated at USD 25