How SBR and AAO Processes Actually Work
SBR (Sequencing Batch Reactor) runs biological nutrient removal inside a single tank on a time-based cycle: fill → react (with sequential anaerobic, anoxic, and aerobic sub-phases driven by intermittent aeration) → settle → decant → idle. Because settling happens in the same vessel, the SBR configuration eliminates the dedicated secondary clarifier required by continuous-flow systems and turns the tank itself into the clarifier during the settle phase. Cycle time is typically 4–8 hours depending on influent strength and effluent targets, and the equalization volume inside the reactor smooths out hourly flow swings that would upset a continuous train.
AAO (Anaerobic/Anoxic/Oxic, widely referred to as the A2O process) is a continuous-flow, three-zone configuration. Mixed liquor travels through an anaerobic zone for enhanced biological phosphorus removal, an anoxic zone for denitrification using the internal carbon from the anaerobic effluent, and an aerobic zone for nitrification and phosphorus uptake. Mixed-liquor and sludge return loops (typically 50–100% RAS and 100–300% internal recycle) feed nitrified liquor back to the anoxic zone and settle biomass out in a downstream clarifier. The configuration is the workhorse of municipal biological nutrient removal plants with stable influent and large throughputs above 10,000 m³/d.
The decisive mechanical difference is aerobic contact time. In AAO, mixed liquor is in continuous aerobic contact for the full hydraulic residence, which drives a measured nitrification rate of 1.48 mgNH3-N/(gVSS·h) versus 0.59 mgNH3-N/(gVSS·h) in AAO-SBR under comparable loading (Nie et al. 2022). SBR compensates by extending total cycle time and concentrating MLSS during react, but for ammonia-dominant effluent limits the continuous aerobic zone in AAO delivers roughly 2.5× the specific nitrification rate, which is why high-strength ammonia sites default to continuous-flow configurations.
SBR vs AAO: Head-to-Head Parameter Comparison
The single most-requested artifact in any SBR vs AAO process comparison is a clean parameter matrix. The table below consolidates the typical operating envelope for municipal-strength domestic wastewater (influent COD 250–500 mg/L, NH3-N 20–40 mg/L, TP 3–8 mg/L) using industry design references and the AOA-SBR dataset from Nie et al. 2022 as the SBR-family best-case anchor.
| Parameter | SBR (Sequencing Batch Reactor) | AAO / A2O Process |
|---|---|---|
| Total cycle HRT | 12–24 h (4–8 h per cycle, 2–4 cycles/d) | 6–10 h hydraulic |
| SRT | 10–25 d | 10–20 d |
| MLSS | 2,000–5,000 mg/L (react phase) | 3,000–5,000 mg/L |
| Footprint index | 0.15–0.30 m² per m³/d (single tank, no separate clarifier) | 0.25–0.50 m² per m³/d (three zones + clarifier) |
| COD removal | 85–95% | 85–95% |
| NH3-N removal | 85–95% (cycle-dependent) | 90–98% (continuous aerobic zone) |
| TN removal | 60–80% typical; 79.31% best case at C/P=40 (Nie et al. 2022) | 60–80% standard, 85–95% with step-feed or modified Bardenpho |
| TP removal (biological only) | 70–90% typical; 99.22% at C/P=40 (Nie et al. 2022) | 85–95% at design C/N/P with stable carbon |
| Specific nitrification rate | 0.59 mgNH3-N/(gVSS·h) in AAO-SBR config (Nie et al. 2022) | 1.48 mgNH3-N/(gVSS·h) in AAO config (Nie et al. 2022) |
| Solids separation | In-tank batch settle (no dedicated clarifier) | External secondary clarifier + RAS pumping |
| Flow equalization | Built into the cycle | Requires upstream equalization basin for variable flow |
| Operating staff intensity | Higher cycle-control automation, lower pumping tuning | Lower controls complexity, more return-sludge and recycle tuning |
One documented failure mode specific to biological phosphorus removal in SBR-family reactors is the accumulation of apatite (AP) in the activated-sludge floc when the influent C/P ratio drops below 40. The Nie et al. 2022 study showed AP buildup inhibited PAO and DPAO activity, dropping TP removal sharply at C/P = 24, 17, and 13. AAO plants see the same effect, but the continuous internal recycle distributes the impact differently and carbon supplementation is easier to schedule on a continuous basis. Treat the C/P=40 threshold as a hard lower bound for biological-only TP removal in either configuration; below it, add chemical polishing or external carbon.
When SBR Beats AAO — and When It Doesn't
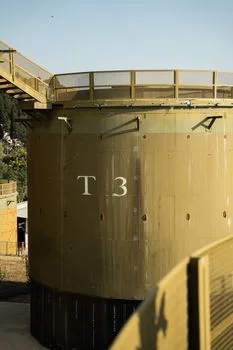
Pick SBR when influent flow is highly variable. Tourist towns, seasonal food-processing discharges, and campus or resort developments all generate diurnal and seasonal peaks that would push a continuous AAO train into hydraulic overload or washout. The SBR cycle's built-in equalization volume absorbs those swings without a separate balancing basin. Batch-mode nitrification denitrification inside the same vessel also lets you lengthen the anoxic phase on high-strength days without reconfiguring piping.
Pick SBR when footprint is constrained. A single-tank batch design typically uses 20–40% less land than a three-zone AAO train with clarifier, return-sludge pump station, and internal recycle. For retrofits into existing structures — old Imhoff tanks, package-plant footprints, or underground installations — SBR usually wins on civil works. For greenfield sites with cheap land and high throughput, the land advantage of SBR shrinks to a rounding error.
Pick AAO when effluent ammonia or total nitrogen is the binding permit limit. The 2.5× specific nitrification rate advantage (1.48 vs 0.59 mgNH3-N/gVSS·h) translates directly into smaller aerobic volume or higher ammonia load capacity for the same tankage. For high-ammonia industrial sites or plants facing strict year-round NH3-N limits (typically 1–3 mg/L), continuous aerobic contact is the safer choice.
Pick AAO when the influent C/P ratio is stable at or above 40 and you want reliable simultaneous biological nitrogen and phosphorus removal. The Nie et al. 2022 data set the C/P=40 threshold as the operational ceiling before apatite inhibition begins to compromise TP performance. A continuous AAO train is easier to operate at that sweet spot consistently than a batch SBR whose cycle phasing has to be retuned for seasonal carbon shifts. If the site is C/P-deficient, run external carbon dosing — the operational detail is covered in our carbon source dosing OPEX playbook — and verify that the receiving headworks can deliver the supplemental carbon on the schedule the reactor needs.
2026 CAPEX and OPEX Reality Check
Process selection usually dies or lives on the budget sheet, so the cost picture in 2026 is worth a clean look. Treat the ranges below as industry-typical 2026 estimates that the engineer should validate against local vendor quotes and site-specific civil conditions.
| Cost line | SBR | AAO / A2O |
|---|---|---|
| New-build CAPEX index (USD per m³/d capacity, including civil, blowers, controls) | USD 220–380 | USD 240–420 |
| Retrofit CAPEX (existing aeration tank or clarifier present) | USD 280–450 (new SBR train in parallel) | USD 190–340 (15–25% lower than new SBR; reuse existing tanks) |
| Energy OPEX (USD per m³ treated) | USD 0.04–0.08 (10–20% lower at flows <5,000 m³/d due to less sludge recirculation pumping) | USD 0.05–0.09 |
| Chemical OPEX (USD per m³ treated) | USD 0.02–0.05 (higher for biological P polishing at low C/P) | USD 0.02–0.04 |
| Sludge handling OPEX | USD 0.03–0.06 | USD 0.03–0.06 |
| Typical energy intensity | 0.18–0.28 kWh/kg COD removed | 0.20–0.32 kWh/kg COD removed |
For a new build below 5,000 m³/d, SBR typically lands within 5–10% of AAO on total CAPEX once you credit the eliminated secondary clarifier and the smaller blower sizing from intermittent aeration. Above 10,000 m³/d, AAO's continuous operation and lower cycle-control instrumentation start to win on OPEX, mostly because the labor and SCADA complexity of running multiple SBR basins in parallel scales worse than a single continuous train. Retrofit economics favor AAO by 15–25% because the existing aeration tank and clarifier can be repurposed as the aerobic and solids-separation stages, with new anaerobic and anoxic zones built in or carved out of headworks. Where the existing asset is an in-ground concrete basin without a clarifier, the math flips and SBR becomes the retrofit winner.
Energy trade-off deserves a closer look. SBR's intermittent aeration cuts blower runtime in the react phase and eliminates return-activated-sludge pumping during settle and decant, which is why small-to-medium SBR plants benchmark 10–20% lower specific energy at flows below 5,000 m³/d. Above that threshold the AAO internal recycle (typically 100–300% of forward flow) drives comparable or slightly higher energy intensity. For very high effluent-quality demands, the MBR membrane bioreactor system can be coupled with either configuration to push TSS and turbidity below 1 mg/L — the membrane stage replaces or supplements the secondary clarifier and adds 0.05–0.10 kWh/m³ to the energy bill but tightens effluent quality beyond what gravity settling can deliver.
Matching the Process to Your Site: A Four-Question Decision Tree
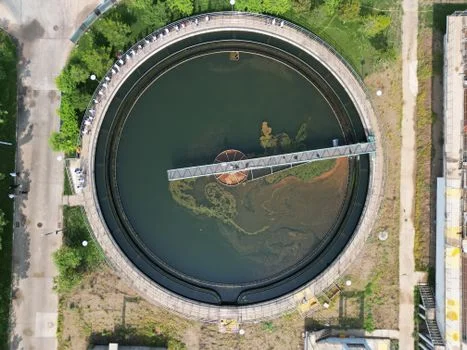
Run the four questions below in order; the first one that answers decisively usually points to the right configuration. Treat the answers as direction-setting, not as a hard veto — site-specific influent characterization, discharge permit wording, and contractor preference still matter.
- Is the influent flow steady or variable? Variable (diurnal swing >2:1, strong seasonal component, batch industrial discharges) → SBR, because equalization is built into the cycle. Steady (municipal base load, <1.5:1 diurnal swing) → AAO is viable, and the rest of the questions become the tiebreaker.
- Is the binding effluent limit ammonia/N or phosphorus? Ammonia or total nitrogen → AAO, because the 1.48 mgNH3-N/gVSS·h nitrification rate beats the SBR-family 0.59 figure. Phosphorus only, with influent C/P stable at or above 40 → SBR is viable, anchored to the 99.22% TP removal at C/P=40 from Nie et al. 2022.
- Is land area constrained below roughly 0.3 m² per m³/d? Yes → SBR, with the 20–40% footprint advantage decisive. No → AAO remains competitive and benefits from cheaper civil construction at scale.
- Is there an existing aeration tank or clarifier that can be retrofit? Yes → AAO retrofit, 15–25% CAPEX advantage. No → run the full greenfield CAPEX comparison in the table above; new-build SBR and AAO usually land within 5–10% of each other on total installed cost at municipal scale.
For sites with both flow variability and tight ammonia limits, a hybrid is worth pricing: an SBR reactor with extended anoxic hold time, or an AAO train with a large upstream equalization basin sized for the design peaking factor. For sites with very high TDS that disrupt nitrification kinetics, the influent pretreatment train needs to be solved first; the high-TDS wastewater process selection guide walks through that sequencing in more detail.
Frequently Asked Questions
Does SBR need an external clarifier? No. The SBR cycle includes a dedicated settle phase inside the same tank, so the reactor acts as its own clarifier. AAO and other continuous-flow configurations require a downstream secondary clarifier with return-activated-sludge pumping.
What influent C/P ratio is required for biological phosphorus removal in SBR or AAO? Stable C/P at or above 40 is the documented threshold for reliable biological TP removal. Below C/P=40, apatite accumulation inhibits PAO activity and TP removal drops sharply (Nie et al. 2022); plan chemical polishing or external carbon dosing to hold effluent TP limits.
How much footprint does SBR save over AAO? SBR's single-tank batch configuration typically uses 20–40% less land than a three-zone AAO train with secondary clarifier, return-sludge pump station, and internal recycle piping. The advantage is largest at flows below 5,000 m³/d and shrinks at municipal scale where AAO's continuous operation can justify a more compact layout.
Is retrofitting an existing plant to AAO cheaper than building a new SBR? Yes, by roughly 15–25% on CAPEX, because existing aeration tanks and clarifiers can be repurposed as the aerobic zone and solids-separation stage. For plants without an existing clarifier, SBR is usually the more economic retrofit because it needs only a single basin with cycle-controlled aeration and decant.
How much does SBR or AAO cost to run in 2026? Industry-typical 2026 energy OPEX is USD 0.04–0.08 per m³ treated for SBR and USD 0.05–0.09 per m³ for AAO, with SBR running 10–20% lower at flows below 5,000 m³/d due to less sludge recirculation pumping. Total OPEX (energy + chemical + sludge) typically lands in the USD 0.09–0.19 per m³ range for either configuration at municipal strength. Validate these numbers against local quotes and tariff structures before finalizing the budget.
Which configuration is easier to automate? Both are strong candidates, but SBR's discrete cycle phases map cleanly onto PLC ladder logic and modern SCADA, which is why small municipal retrofits often combine SBR with the AI process control buyer's guide decision framework. AAO's continuous tuning of return-sludge and internal recycle rates benefits more from model-predictive control. For very tight sites, the WSZ underground packaged plant ships as a pre-engineered SBR module with factory-tested controls, which is often the fastest path to compliant operation on a constrained footprint.