A SiC wastewater resource recovery system combines DAF, MBR, SiC ceramic membrane filtration, and RO to recover 98.1% of SiC particles at 98%+ purity for semiconductor and EV plants, with OPEX of $0.80–$1.50/m³.
Why a SiC Wastewater Resource Recovery System Pays Off in 2026
Global SiC wafer production is expanding at a 30% CAGR through 2030, according to Yole Développement (2024). Grinding and dicing use 1.5–3 m³ of water per wafer, and approximately 80% becomes hazardous effluent (UltraFacility, 2023). On-site recovery cuts OPEX to $0.80–$1.50/m³ and avoids landfill fees of $150–$400 per ton (World Bank, 2025).
The arithmetic is stark at plant scale. A Shenzhen fab producing 50,000 wafers per month generates roughly 60,000 m³ of SiC-laden effluent each year. At $150–$400 per ton for SiC-rich hazardous material, hauling that stream off-site becomes the dominant waste line item. Most fabs we size systems for now budget for recovery instead of disposal.
Silicon carbide itself is built for recovery: the material is chemically inert and insoluble in water (Wikipedia), so particles survive grinding slurries unchanged and can be washed and resold as abrasive feedstock. Regulatory pressure points the same way. China's GB 31573-2015 and the US EPA rule at 40 CFR Part 469 both cap effluent at TSS below 30 mg/L and COD below 100 mg/L. Non-compliance can draw daily fines of up to $50,000.
How SiC Wastewater Recovery Works: Step-by-Step Process Flow
The train follows the classic industrial wastewater treatment process steps of solids removal, biological treatment, and polishing, tuned for SiC recovery. Dissolved Air Flotation (DAF) opens the sequence. Micro-bubbles of 40–60 μm lift approximately 85–90% of suspended SiC particles to the surface for skimming, with a short retention time of 3–5 minutes. Rapid bubble generation keeps skimming efficiency high even at peak slurry loads.
A Membrane Bioreactor (MBR) stage follows. PVDF membranes with a 0.1 μm pore size deliver 92–97% COD removal when MLSS is held at 8,000–12,000 mg/L and flux at 15–25 LMH. Most plants we size for grinding effluent run at the lower end of that flux band to slow fouling between cleans.
SiC ceramic membrane filtration then does the recovery work. Membranes with 0.05–0.2 μm pores, operating at 1–3 bar and cross-flow velocities of 3–5 m/s, recover 98.1% of SiC particles at purity exceeding 98% (2026 HydropureWater data). A final Reverse Osmosis (RO) stage polishes the effluent for reuse, dropping TDS below 10 mg/L. The table below summarizes each stage.
| Stage | Primary Function | Key Parameters | Efficiency | Technology |
|---|---|---|---|---|
| 1. Dissolved Air Flotation (DAF) | Suspended Particle Removal | Bubble Size: 40–60 μm; Retention Time: 3–5 min | 85–90% suspended SiC removal | Micro-bubble generation and skimming |
| 2. Membrane Bioreactor (MBR) | COD and Fine Particle Removal | MLSS: 8,000–12,000 mg/L; Flux: 15–25 LMH; Pore Size: 0.1 μm | 92–97% COD removal | PVDF membranes |
| 3. SiC Ceramic Membrane Filtration | High-Purity SiC Particle Recovery | Pore Size: 0.05–0.2 μm; Pressure: 1–3 bar; Cross-flow: 3–5 m/s | 98.1% SiC recovery, 98%+ purity | SiC ceramic membranes |
| 4. Reverse Osmosis (RO) | TDS Reduction for Water Reuse | Recovery Rate: 75–85%; Energy: 0.5–1.5 kWh/m³; Antiscalant: 2–5 ppm | <10 mg/L TDS | RO membranes |
| 5. Optional Ion Exchange/Electrodialysis | Ultra-Pure Water Production | Resin Type: Mixed-bed; Regeneration: 12–24 hrs | 18 MΩ·cm resistivity | Ion exchange resins/Electrodialysis |
For that first stage, our Dissolved Air Flotation (DAF) machine combines micro-bubble generation and skimming in one skid. The membrane stages deserve a closer look next.
SiC Ceramic Membrane Filtration for Semiconductor Wastewater
SiC ceramic membrane filtration for semiconductor wastewater recovers 98.1% of particles at 98%+ purity when run at 1–3 bar with 3–5 m/s cross-flow. A ceramic membrane for water treatment made from silicon carbide is unusually fit for this duty. According to Wikipedia, the material is “highly inert chemically, partly due to the formation of a thin passivated layer of SiO2,” and it is insoluble in water. That inertness tolerates the aggressive acid and oxidant cleaning cycles that polymer membranes cannot survive.
Format choice trades flux against packing density on the skid. If your feed is silica-rich dicing effluent rather than SiC grinding slurry, the duty differs; our ceramic membrane water guide covers that stream separately.
SiC Membrane Suppliers Compared: Performance, Cost, and Material Grades
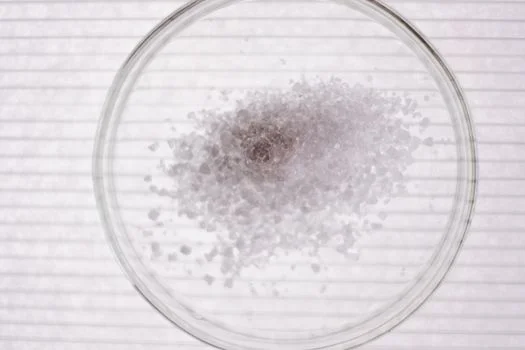
Established suppliers such as LiqTech, Cembrane, and Pall offer SiC membranes with comparable core specifications. Typical products feature pore sizes of 0.05–0.2 μm, flux rates between 100–300 LMH, and tolerance of pH 0–14 plus chlorine concentrations up to 1000 ppm. Price per square meter generally falls between $500–$1,200, driven by manufacturing process and material composition.
| Supplier | Pore Size (μm) | Flux (LMH) | pH Range | Chlorine Resistance (ppm) | Price ($/m²) | Material Grade Notes |
|---|---|---|---|---|---|---|
| LiqTech | 0.05–0.2 | 100–300 | 0–14 | 1000 | $500–$1,200 | Recrystallized/Sintered; high-performance |
| Cembrane | 0.05–0.2 | 100–280 | 0–14 | 1000 | $550–$1,100 | Sintered; robust chemical resistance |
| Pall | 0.05–0.2 | 120–300 | 0–14 | 1000 | $600–$1,200 | Sintered; tailored for industrial applications |
| Veolia | 0.05–0.2 | 100–250 | 0–14 | 1000 | $500–$1,100 | Recrystallized; cost-effective options |
For the biological stage feeding these membranes, explore our MBR membrane bioreactor module. Well-designed trains combine stages rather than rely on any single one.
Hybrid System Design: DAF + MBR + SiC + RO for Zero-Discharge Compliance
A hybrid DAF + MBR + SiC + RO train fits plants with 50–200 m³/h of SiC-laden effluent and occupies 30–50% less space than conventional multi-stage treatment. The layout flows from DAF to an equalization tank, then the MBR, then the SiC membrane skid, and finally the RO units. Equipment sizing scales proportionally across the 50–200 m³/h band. A 100 m³/h plant is essentially two 50 m³/h trains in parallel, which lets fabs add capacity without redesigning the front end.
To manage flows with advanced biological treatment, consider our MBR integrated wastewater treatment system. For high-purity water generation, our Reverse Osmosis (RO) water purification systems close the reuse loop. Economics decide the final configuration.
SiC Wafer Manufacturing Wastewater Treatment Cost: CAPEX, OPEX, and Payback
SiC wafer manufacturing wastewater treatment cost splits into CAPEX of $1.8 million to $4.2 million for 50–200 m³/h systems and OPEX of $0.80–$1.50 per cubic meter (2026 HydropureWater benchmarks). Micro-powder plants typically reach payback in 3 years because their disposal burden per cubic meter is highest. Semiconductor plants recover the investment in 2.5–3.5 years, while lower-volume EV lines run 4.5–5.5 years. Water reuse of 80–95% is the lever that moves these numbers most.
| Scenario | Annual Water Volume (m³) | Disposal Cost Savings ($/ton) | Water Reuse Rate (%) | Estimated CAPEX ($M) | Estimated OPEX ($/m³) | Payback Period (Years) |
|---|---|---|---|---|---|---|
| Semiconductor Plant (50k wafers/month) | ~720,000 | $300 | 90% | $2.5 - $3.5 | $1.00 - $1.50 | 2.5 - 3.5 |
| EV Plant (10k wafers/month) | ~144,000 | $250 | 80% | $1.8 - $2.8 | $0.80 - $1.30 | 4.5 - 5.5 |
| Micro-powder Plant (High Volume) | ~1,000,000+ | $400 | 95% | $3.0 - $4.0 | $0.80 - $1.20 | 2.0 - 3.0 |
Regulatory Compliance: Meeting Global Standards for SiC Wastewater Discharge
GB 31573-2015 in China and the US EPA's 40 CFR Part 469 both set effluent limits of TSS below 30 mg/L and COD below 100 mg/L for electronics plants. Per the US EPA regulation, 40 CFR Part 469 is the Electrical and Electronic Components Point Source Category, with semiconductor dischargers governed by Subpart A (§§ 469.10–469.19). Hybrid SiC-RO systems meet these limits while achieving up to 99% water recovery. Before any industrial waste discharge leaves the site, install online TSS and COD monitoring to document compliance continuously.
Specify four inputs before requesting quotes: wafer output and slurry TSS load, target reuse rate (80% or 95%), footprint limits, and the discharge standard that applies to your site. Our engineers size the full SiC wastewater resource recovery system from those four inputs. Send your parameters through our quote request form for a sized proposal with ROI figures.
Frequently Asked Questions
What is the difference between SiC and ceramic membranes for SiC recovery?
SiC membranes are themselves a ceramic subtype, and the silicon carbide chemistry gives the class its strongest resilience. They tolerate pH 0–14 and chlorine up to 1000 ppm, which permits aggressive chemical cleaning between runs. On SiC recovery duty they deliver 98.1% particle recovery at 98%+ purity.
How often do SiC membranes need cleaning?
Cleaning frequency is dictated primarily by the TSS concentration of the incoming wastewater. After DAF removes 85–90% of suspended SiC upstream, the membrane stage sees a far lighter solids load, and most plants stretch intervals accordingly. The 1000 ppm chlorine tolerance also allows strong NaOCl clean-in-place cycles without membrane damage.
Can SiC recovery systems handle fluoride in semiconductor wastewater?
Yes, SiC membranes resist fluoride well, generally up to 500 ppm. The inert, SiO2-passivated surface holds up where polymer coatings fail. For feeds above that band, plan a fluoride precipitation step ahead of the membrane skid.
How does the SiC particle recovery 98 percent purity process work?
The process chains flotation with ceramic filtration: DAF lifts 85–90% of suspended SiC first, then 0.05–0.2 μm SiC membranes at 1–3 bar recover 98.1% of remaining particles at 98%+ purity. A cross-flow velocity of 3–5 m/s keeps the membrane surface scoured. Recovered solids are washed and dewatered for resale as abrasive feedstock.
What is the semiconductor wastewater reuse ROI payback period?
Semiconductor plants reclaim their investment in 2.5–3.5 years at 50,000 wafers per month, with 90% water reuse and OPEX of $1.00–$1.50/m³. EV plants at 10,000 wafers per month run 4.5–5.5 years. High-volume micro-powder plants perform best at 2.0–3.0 years with 95% reuse.