Ceramic Membrane Semiconductor Wastewater Treatment: 2027 Design Brief
Ceramic membrane semiconductor wastewater treatment centers on fluoride, CMP solids, and solvent COD control: fab streams carry COD 500–5,000 mg/L, fluoride 10–500 mg/L, and TSS 200–2,000 mg/L. MBR-RO hybrids reach 92–97% COD removal. Suppliers get scored on pilot data and fouling control.
A microelectronics supplier for fab wastewater systems sizes trains for COD at 500–5,000 mg/L, fluoride at 10–500 mg/L, and TSS at 200–2,000 mg/L. MBR-RO hybrids commonly reach 92–97% COD removal and fluoride near <1.5 mg/L with correct precipitation. Fab designs need HF/NH4F-resistant materials and fouling control. CAPEX spans about $250K for small DAF packages to $40M for ZLD plants.
Why Microelectronics Wastewater Demands Specialized Treatment
Microelectronics wastewater streams differ by tool set. CMP slurries carry abrasive SiO2 or Al2O3 particles. Photoresist strippers use NMP and DMSO. Etching baths hold HF and NH4F. Metal plating lines release copper, nickel, and gold. According to HydropureWater field data (2025), mixed streams scale membranes fast and raise chemical use. Many plants we size for still run segregation poorly on day one, and the penalty shows up as flux loss within weeks, not years.
Permit targets are often tighter than categorical floors. Earlier buyer briefs cited fluoride near <4 mg/L (EPA context) or <1.5 mg/L (EU-style local limits), with COD <125 mg/L, TSS <30 mg/L, copper <0.5 mg/L, and nickel <0.1 mg/L. Under 40 CFR Part 469 Subpart A BAT/NSPS, semiconductor fluoride limits are 32.0 mg/L daily maximum and 17.4 mg/L as a 30-day average (eCFR, current). TTO sits at 1.37 mg/L, and permits typically hold pH between 6.0 and 9.0. Local POTW permits frequently set lower fluoride than that categorical ceiling.
Civil penalty exposure for Clean Water Act exceedances is commonly discussed in the $25,000–$100,000 per day range in procurement briefs, and EPA adjusts those civil maximums upward for inflation most recently in its January 2025 rule. Water reuse is the other driver. Modern fabs reclaim about 30–50% of process water and cut municipal supply cost by roughly $0.50–$2.00/m³. That credit often offsets higher CAPEX over a 3-to-5-year horizon when reuse water quality holds.
| Contaminant Source | Primary Pollutants | Typical Concentration (mg/L) | Target Discharge Limit |
|---|---|---|---|
| CMP Slurry | SiO2, Al2O3, TSS | 500 – 2,500 | <30 mg/L |
| Etching Baths | Fluoride (HF, NH4F) | 100 – 500 | <1.5 – 4.0 mg/L |
| Photolithography | COD (NMP, DMSO) | 500 – 5,000 | <125 mg/L |
| Metal Plating | Cu, Ni, Au, Sn | 10 – 150 | Cu <0.5, Ni <0.1 mg/L |
Fluoride Removal: Technologies, Costs, and Supplier Capabilities
Two-stage chemical precipitation remains the standard for high-concentration fluoride, reaching effluent levels <1.5 mg/L with calcium chloride (CaCl2) then aluminum sulfate (Al2(SO4)3). In stage one, CaCl2 at pH 8–9 forms CaF2 and typically drops fluoride to about 10–20 mg/L. Stage two uses Al2(SO4)3 at pH 6–7 so aluminum hydroxide flocs adsorb residual fluoride. Implementing precise chemical dosing for fluoride precipitation keeps compliance stable and limits sludge volume (HydropureWater field data, 2025).
Adsorption media polish low-concentration streams. Activated alumina typically holds 2–4 mg/g fluoride. Bone char provides about 5–7 mg/g. High-performance ion exchange resins can reach 10–15 mg/g but raise regeneration cost. Media OPEX usually falls between $0.20 and $1.50/m³, depending on influent strength and change-out frequency.
Reverse osmosis rejects about 95–99% of fluoride when pretreatment stops CaF2 scaling. Antiscalant dosing and pH control are non-negotiable before the membranes. High-rate clarifiers can remove about 90% of fluoride in roughly 15 minutes where floor space is tight. For strong HF streams, ceramic ultrafiltration often outlasts polymeric UF. Where silica-rich dicing water is also present, see ceramic membrane water guidance on ultrafiltration recovery trains.
| Technology | Removal Efficiency | OPEX ($/m³) | Best Use Case |
|---|---|---|---|
| CaCl2 Precipitation | 85 – 90% | $0.30 – $0.60 | High-concentration HF waste (>100 mg/L) |
| Alum Coagulation | 95 – 98% | $0.40 – $0.80 | Polishing stage for <2 mg/L targets |
| Activated Alumina | 90 – 95% | $0.80 – $1.20 | Small-scale or low-concentration polishing |
| RO Filtration | 99% + | $1.00 – $2.50 | Water reuse and ZLD applications |
Ceramic Membrane Fluoride Removal Fab Wastewater Trains
Ceramic membrane fluoride removal fab wastewater duty pairs the precipitation stages with a chemically robust barrier that survives CaF2 carryover and acidic swings. Ceramic elements tolerate pH 0–14 and aggressive cleaning, so operators can strip scaling without shortening element life. That regulatory stability lets fabs lock a fluoride train design without waiting for new categorical limits.
MBR vs. RO for Semiconductor Wastewater: Zero-Fouling Designs and Trade-offs
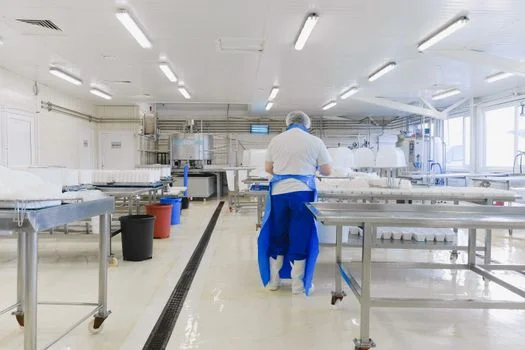
Membrane bioreactor and reverse osmosis units play different roles in a semiconductor wastewater train. MBR targets organic degradation and solids separation. RO targets dissolved ions and fluoride polishing. MBR effluent typically shows <1 μm particles and about 99% bacteria removal, which is strong RO pretreatment. RO filters to <0.001 μm and can reach about 99.9% ion removal for reuse or UPW makeup. Using RO systems for ultra-pure water reuse in fabs cuts freshwater demand when conductivity and silica stay in spec.
Zero Fouling Ceramic Membrane Semiconductor Fab Duty
Zero fouling ceramic membrane semiconductor fab designs decide whether a train survives CMP slurry and solvents. PVDF membranes at about 0.1 μm pore size often last 3–5 times longer than PES in microelectronics duty. Ceramic membranes near 0.05 μm can approach a 20-year life, though CAPEX is often about 10 times PVDF. PVDF commonly tolerates HF up to about 5%. Ceramic is preferred for higher HF or aggressive NMP streams (Nanostone 2026 specs).
Ceramic Membrane vs PVDF Microelectronics Wastewater Duty
Ceramic membrane vs PVDF microelectronics wastewater selection comes down to HF percent, solvent aggression, and budget cap. Moderate chemistry with capped capital points to PVDF at roughly 0.1 μm and HF tolerance near 5%. Higher HF strength, NMP exposure, or abrasive CMP solids point to ceramic despite the roughly 10x CAPEX multiple. Integrating fab-ready MBR systems for semiconductor wastewater helps the biology ride batch load swings upstream of either membrane choice.
Money follows the membrane choice. MBR CAPEX usually sits at $1.2M–$15M with OPEX about $0.80–$1.50/m³. RO CAPEX often runs $2M–$20M with OPEX about $1.00–$2.50/m³. Hybrid MBR-RO trains feed many ZLD projects: MBR cuts organics, RO polishes for reuse, and brine goes to evaporators.
| Feature | MBR (PVDF) | RO (Spiral Wound) | Ceramic UF |
|---|---|---|---|
| Pore Size | 0.03 – 0.1 μm | <0.001 μm | 0.01 – 0.05 μm |
| Fouling Resistance | High (Air Scour) | Low (Requires Pretreatment) | Very High (Chemical Wash) |
| Chemical Resistance | pH 2–11, 5% HF | pH 3–10, Sensitive to Oxidants | pH 0–14, High Solvent Resistance |
| CAPEX Benchmark | Moderate ($1.2M+) | High ($2M+) | Very High ($5M+) |
Ceramic Ultrafiltration CMP Slurry HF Etch Streams
Ceramic ultrafiltration CMP slurry HF etch service combines two punishing loads in one barrier. CMP slurry runs 500–2,500 mg/L of abrasive SiO2 or Al2O3 that wears polymeric elements, while etch drains carry 100–500 mg/L fluoride at low pH. Ceramic elements shrug off both the abrasion and the acidity, and periodic chemical washes restore flux without replacement. Plants running mixed CMP and etch drains without segregation burn through polymeric UF budgets quickly, which is why segregation stays step one in most retrofits.
How to Evaluate a Microelectronics Supplier for Fab Wastewater
Procurement teams should score a microelectronics supplier on process chemistry skill, not unit price alone. Start with technical specifications. Demand 12-month pilot data for COD/TSS removal and fluoride handling under peak load. Ask for fouling resistance results and the Flux Enhancement Coefficient when CMP slurry is present.
Compliance and certification come next. Confirm ISO 14001 practice and NPDES or local pretreatment familiarity. For Asia expansions, check Taiwan EPA and China MEE permit experience. Cost transparency is third: itemize CAPEX for equipment, installation, and commissioning, and OPEX for chemicals, energy, and membrane replacement (typically 3–5 years for PVDF).
Scalability and modularity matter for growing fabs. Modular MBR skids in about 50 m³/day steps support phased spend. Lead times for fab-scale systems often run 6–12 months, so long-lead pumps and membranes in inventory matter. Lifecycle support should include IoT/SCADA remote monitoring, 24/7 response, and on-site EHS training so operators keep flux and dose setpoints honest.
CAPEX and OPEX Benchmarks for Fab-Scale Wastewater Systems
Total cost of ownership tracks required effluent purity. Dissolved air flotation for TSS and CMP slurry sits at about $250K–$2M CAPEX. Full-scale MBR systems range from $1.2M to $15M. RO reuse trains scale from about $2M to $20M. Zero liquid discharge plants with evaporation and crystallization often reach $15M–$40M for large fabs. Parallel Chip Fab Wastewater Treatment: 2026 Engineering Specs, Zero-Fouling Design benchmarks show similar bands when tool counts grow.
Operational expenses are driven primarily by chemical consumption and energy. Fluoride treatment alone can account for 20–30% of total OPEX due to the high volumes of CaCl2 and coagulants required. Most plants we size for land near the lower OPEX band only after stream segregation and antiscalant control stabilize.
Selection checklist for fab wastewater CAPEX reviews:
- Confirm peak fluoride (mg/L) and whether CaCl2 + alum polishing is required before membranes.
- Separate CMP slurry, HF etch, and solvent stripper drains before biological or RO stages.
- Match membrane material to HF percent and solvent exposure (PVDF vs ceramic).
- Budget membrane replacement at 3–5 years for PVDF and verify cleaning chemical OPEX.
- Price reuse credit at $0.50–$2.00/m³ against municipal supply before accepting ZLD scope.
- Require 12-month pilot flux data under peak COD and TSS, not average day only.
- Lock spare long-lead items if the construction window is under 12 months.
Can Semiconductor Fabs Achieve Zero Liquid Discharge?
Semiconductor fabs can achieve zero liquid discharge when MBR or equivalent organics removal, RO polishing, and brine evaporation or crystallization are sequenced correctly. Typical ZLD CAPEX lands near $15M–$40M for large fabs, with RO OPEX about $1.00–$2.50/m³ before thermal stages. Hybrid MBR-RO cuts organic load before the evaporators and lowers scaling risk on heat-transfer surfaces.
What Does Semi Fab Zero Liquid Discharge Cost?
Semi fab zero liquid discharge cost is dominated by evaporators and crystallizers after RO, not by the biological skid alone. Budget bands of $15M–$40M cover large fabs when brine volume stays high. Reuse of 30–50% RO permeate reduces freshwater purchase before the thermal step. If local discharge permits already allow fluoride near the 40 CFR 469 categorical averages, full ZLD is often a corporate water goal rather than a permit minimum.
Who This Is For and Next Step
This guide is for fab EHS, process, and procurement teams comparing DAF, fluoride precipitation, MBR, RO, and ZLD packages. It is less useful for municipal-only plants without HF, CMP, or solvent streams. If you need a sized train against your peak COD, fluoride, and reuse targets, request a fab wastewater treatment quote with influent data and permit limits attached.
Frequently Asked Questions
What fluoride limit applies to US semiconductor discharges?
Under 40 CFR Part 469 Subpart A BAT and NSPS, fluoride limits are 32.0 mg/L maximum for any 1 day and 17.4 mg/L as a 30-day average for covered semiconductor sources. Many local permits still write much tighter end-of-pipe fluoride targets near <1.5–4.0 mg/L. Always design to the controlling permit, not only the categorical table.
When should a fab choose MBR before RO?
Choose MBR before RO when COD sits in the 500–5,000 mg/L band and bacteria or fine solids would foul RO. MBR effluent near <1 μm particle size and about 99% bacteria removal protects spiral-wound elements. Skip biology only when the load is mostly inorganic fluoride and metals with little biodegradable solvent COD.
How much CAPEX should a small fab expect?
Small fabs often start at about $250K–$2M for DAF-focused TSS and CMP control, then $1.2M+ once MBR enters scope. RO reuse commonly adds from about $2M upward. Full ZLD at $15M–$40M is usually reserved for large sites or corporate zero-discharge mandates.
What drives OPEX on fluoride-heavy etch waste?
Fluoride chemistry often consumes 20–30% of total OPEX through CaCl2 and coagulant dose. Two-stage precipitation to <1.5 mg/L needs stable pH control at 8–9 then 6–7. Poor dosing raises sludge haul cost faster than it improves compliance.
What makes ceramic membrane water reuse semiconductor plant projects pay off?
Reuse pays when RO permeate displaces municipal supply worth $0.50–$2.00/m³. Modern fabs reclaim 30–50% of process water, and that credit often offsets higher CAPEX over a 3-to-5-year horizon when reuse water quality holds. Ceramic UF in front of RO protects the membranes from HF and abrasive CMP solids, keeping permeate conductivity and silica in spec.