What Does Wastewater Treatment in Al Khobar Cost in 2026?
Al Khobar wastewater treatment plant cost for industrial projects in 2026 typically runs SAR 2.5–6.5 million at 100 m³/day and SAR 95–240 million at 10,000 m³/day across CAS, SBR, and MBR trains. Unit CapEx spans SAR 30,000–50,000 per m³/day at 100 m³/day scale and SAR 15,000–25,000 per m³/day at 10,000 m³/day. Nutrient limits and coastal civil works add 12–20%.
Eastern Province industrial flows have grown about 18% per year from 2020 to 2025, led by petrochemical expansion around Saudi Aramco and SABIC and by food plants in Dammam 2nd Industrial City. Earlier planning language often framed 95% coverage as a near-term Eastern target. According to SWPC (2024), citing MEWA and NWC, national network coverage stood at 64% in 2024, with 95% coverage and 70% treated sewage effluent (TSE) reuse targeted for 2030.
National wastewater volume is projected to rise from 6.85 million m³/day in 2024 to 14.10 million m³/day in 2030. Required treatment capacity reaches 14.80 million m³/day after a 5% buffer (SWPC, 2024). According to the World Bank, water security across the Middle East and North Africa means much more than coping with water scarcity, which is why reuse economics now belong inside plant sizing decisions. FAO's AQUASTAT profile for Saudi Arabia tracks the national wastewater production and reuse data behind such projections.
Al Khobar's high soil salinity and elevated water table raise civil works by about 15–20% versus inland sites. Under Long-Term Operation and Maintenance (LTOM) Package 9 for Al Khobar municipal assets, PPP structures can shift 20–30% of initial CapEx to private operators against 15–20 year O&M contracts. For shared industrial parks, that structure often matters more than the headline equipment price.
Al Khobar Wastewater Treatment Plant Cost by Capacity and Technology
Beyond the headline cost bands, capital outlay for industrial trains tracks economy of scale and process choice. Membrane bioreactor (MBR) packages typically carry a 30–50% CapEx premium over conventional activated sludge because of membrane modules and higher-duty aeration. Civil works remain the largest single line item at 30–40% of CapEx in the coastal strip. Modular or containerized layouts cut civil scope by about 15–20% and shorten install windows when plot space is tight.
Petrochemical sites with oil and grease shocks usually budget pre-treatment for industrial wastewater with dissolved air flotation (DAF) ahead of biology. That add-on protects biomass and often lowers downstream energy draw. A steady, low-oil load is the weakest case for DAF, where simple equalization does the same job for less.
For inland unit-price contrast, Riyadh's wastewater treatment cost benchmarks remain the closest published regional comparator. Buyers comparing capex and opex structures across markets should normalize for salinity, power tariff, and sludge haul distance before treating any SAR/m³ figure as transferable. The same normalization applies to any vendor quote that mixes municipal and industrial references.
| Plant Capacity (m³/day) | Conventional Tech (SAR) | SBR System (SAR) | MBR System (SAR) | Est. USD Equivalent |
|---|---|---|---|---|
| 100 | 2.5M – 3.5M | 3.2M – 4.5M | 5.0M – 6.5M | $1.33M – $1.73M |
| 500 | 8.0M – 12.0M | 10.5M – 14.0M | 15.5M – 19.5M | $4.13M – $5.20M |
| 1,000 | 14.0M – 18.5M | 18.0M – 24.0M | 28.0M – 36.0M | $7.46M – $9.60M |
| 5,000 | 55.0M – 70.0M | 72.0M – 90.0M | 105M – 135M | $28.0M – $36.0M |
| 10,000 | 95.0M – 125M | 130M – 165M | 190M – 240M | $50.6M – $64.0M |
Most plants we size for Eastern Province factories under 1,000 m³/day land at the lower half of each band when influent COD stays below about 800 mg/L and civil design avoids deep dewatering. High-strength petrochemical or food loads push toward the upper band even before tertiary nutrient stages. Plot shape and setback rules decide whether the containerized option stays open.
How Much Does Operation and Maintenance Cost Each Year?
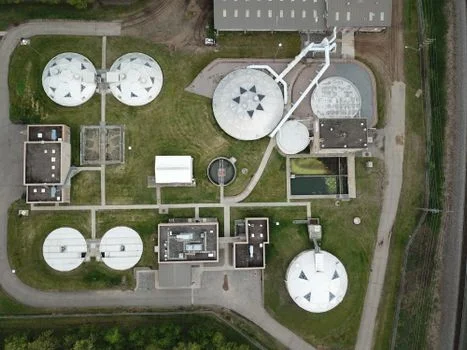
Annual OPEX for Al Khobar industrial plants commonly equals 8–15% of installed CapEx at mid-scale, with energy alone taking 40–50% of the yearly budget. MBR trains draw about 0.8–1.2 kWh/m³ versus 0.4–0.6 kWh/m³ for conventional activated sludge at similar COD. Higher MBR power is often offset by lower sludge haul and tighter effluent that supports reuse.
Strong primary solids removal can cut biological-stage energy by up to 15%; see the pre-treatment cost comparison for industrial plants when oil and floatables dominate the load. For a 1,000 m³/day plant, Eastern Province labor typically runs SAR 1.2–2.0 million per year. SCADA and IoT automation can trim staffing needs by up to 40% under NWC 2025 O&M guidance.
MBR membrane replacement averages SAR 500–800 per m² every 5–8 years; robust fouling control and automated CIP can extend membrane life by about 30%. On a 10-year cash basis, OPEX often exceeds CapEx for energy-heavy MBR plants once membrane swaps and sludge fees are included. Lifecycle models therefore matter more than the first bid sheet when two offers look close on equipment price alone.
| Plant Size (m³/day) | Tech Type | Energy Cost (SAR/m³) | Total OPEX (SAR/m³) | Annual OPEX (SAR) |
|---|---|---|---|---|
| 500 | MBR | 2.5 – 3.5 | 10.0 – 14.5 | 1.82M – 2.64M |
| 1,000 | SBR | 1.2 – 1.8 | 7.5 – 10.5 | 2.73M – 3.83M |
| 1,000 | MBR | 2.2 – 3.2 | 8.0 – 12.0 | 2.92M – 4.38M |
| 5,000 | CAS | 0.8 – 1.2 | 4.5 – 6.5 | 8.21M – 11.8M |
| 5,000 | MBR | 1.8 – 2.6 | 6.0 – 8.5 | 10.9M – 15.5M |
Technology Selection: MBR, SBR, and Conventional Activated Sludge
Technology choice in Al Khobar industrial zones balances effluent quality, plot cost, and sludge disposal. Land values of about SAR 1,200–1,800 per m² push many sites toward MBR systems for Al Khobar's industrial wastewater, which need roughly 35–45% of a conventional footprint. MBR effluent commonly holds COD ≤50 mg/L and TSS ≤5 mg/L, which clears typical NWC 2026 industrial discharge targets with margin for reuse polishing.
What Drives Al Khobar Industrial Wastewater MBR System Cost?
Membrane area, aeration duty, and CIP scope drive Al Khobar industrial wastewater MBR system cost more than any other variables. MBR packages typically carry a 30–50% CapEx premium over conventional activated sludge at the same flow. MBR biology with longer solids retention time also generates about 30% less biological sludge than CAS, saving SAR 50–100 per m³ of sludge disposed under 2025 Saudi Waste Management Center fee bands.
Sequencing batch reactors (SBR) suit variable batch discharges from food and light chemical plants better than continuous-flow CAS. SBRs usually produce more sludge than MBRs but avoid membrane replacement entirely. Steady high-strength petrochemical loads favor continuous MBR when cooling-tower makeup quality is the design driver.
| Parameter | Conventional (CAS) | SBR | MBR |
|---|---|---|---|
| Effluent COD (mg/L) | ≤120 | ≤80 | ≤50 |
| Effluent TSS (mg/L) | ≤30 | ≤20 | ≤5 |
| Footprint Requirement | 100% (Baseline) | 70% - 80% | 35% - 45% |
| Sludge Production | High | Medium | Low (30% less than CAS) |
| Process Stability | Moderate | High (Batch flexibility) | Very High |
Can Treated Effluent Feed Cooling Towers?
Treated sewage effluent can feed cooling-tower makeup when tertiary disinfection and conductivity control meet site metallurgy limits. Most plants we review for Al Khobar petrochemical and data-center adjacent loads target TSS ≤5 mg/L, residual disinfectant control, and stable hardness before blending with freshwater. CapEx for polishing (UF/RO or ion exchange) is project-specific. The reuse credit rises as industrial freshwater tariffs climb, so Vision 2030 TSE reuse targets matter to private balance sheets as well as municipal ones.
Peer-reviewed work listed on PubMed, including Water scarcity in the Kingdom of Saudi Arabia (2024) and Public acceptability of treated wastewater reuse in Saudi Arabia (2020), keeps national reuse policy and practice under independent review.
Regulatory Compliance Costs in Al Khobar
NWC Circular 2025/12 sets industrial discharge expectations that push many Al Khobar sites into tertiary nutrient removal and disinfection. Adding tertiary disinfection for NWC compliance with UV or chlorine dioxide typically adds 12–18% to CapEx versus secondary-only baselines. BOD ≤25 mg/L and fecal coliform limits drive that stage whether effluent goes to the municipal network or to controlled environmental release.
What Does Saudi Arabia NWC Industrial Discharge Compliance Cost?
Saudi Arabia NWC industrial discharge compliance cost usually splits into permitting fees, monitoring packages, and the added treatment stages. Initial permitting fees for industrial plants in Al Khobar range SAR 50,000–200,000 by complexity and flow. LTOM-linked monitoring packages with SCADA and IoT sensors for pH, COD, and flow add about SAR 150,000–300,000 to CapEx and often cut annual OPEX 10–15% through tighter chemical control.
SWPC notes Eastern Region wastewater collected for treatment rising toward about 1.61 million m³/day by 2030 under 95% network coverage assumptions. Municipal connection rules and online monitoring expectations will keep tightening around private outfalls as that build-out proceeds (SWPC, 2024).
| Pollutant Parameter | NWC 2026 Limit | Required Treatment Stage | Est. Compliance Cost (CapEx %) |
|---|---|---|---|
| COD | ≤100 mg/L | Biological (MBR/SBR) | Included in Base |
| BOD | ≤25 mg/L | Secondary/Tertiary | Included in Base |
| Total Nitrogen (TN) | ≤10 mg/L | Anoxic Denitrification | 5% - 8% |
| Total Phosphorus (TP) | ≤1 mg/L | Chemical Precipitation | 3% - 5% |
| Disinfection | <2.2 MPN/100ml | UV / ClO2 Generator | 4% - 6% |
Financing, Incentives, and Payback Windows
NWC LTOM frameworks let qualifying projects shift 20–30% of upfront CapEx to private operators under long-term O&M. Practical entry is usually ≥5,000 m³/day, which suits industrial clusters more than single small factories. MEWA-linked incentives described in prior project practice can cover about 10–15% of CapEx when the design is explicitly reuse-oriented.
Conventional trains in Al Khobar often show 5–7 year payback; MBR systems commonly need 7–10 years but gain from lower sludge fees and higher reuse value. Plants above 1,000 m³/day that add anaerobic digestion for biogas can shorten payback by another 1–2 years when power offset is real, not theoretical. Finance teams should also stress-test electricity tariffs, since aeration dominates the operating bill.
Selection checklist for Al Khobar industrial buyers:
- Confirm design flow at peak day, not average hour, and state COD/BOD/TN/TP with units.
- Price coastal civil premium (salinity, water table) separately from process equipment.
- Decide reuse quality early if cooling-tower or irrigation makeup is part of the ROI case.
- Model membrane replacement and sludge haul for 8–10 years, not only year-one OPEX.
- Ask whether LTOM or shared-facility PPP applies above 5,000 m³/day.
- Budget online monitoring (SAR 150,000–300,000) if NWC connection rules apply.
- Compare SAR/m³ CapEx against sibling markets such as Brazil wastewater plant cost benchmarks only after normalizing power and sludge fees.
Who This Is For and Next Step
This breakdown suits plant engineers, EPC estimators, and procurement teams sizing industrial trains in Al Khobar, Dammam, and nearby Eastern Province estates. Municipal mega-projects already under LTOM packages, or sites seeking only septic haul contracts, should look elsewhere. If you need a capacity- and technology-specific SAR budget for your influent, send the flow sheet through our request-quote form with COD, oil & grease, and reuse targets listed.
Frequently Asked Questions

What Is the Average Cost per m³/Day for a Wastewater Treatment Plant in Al Khobar?
Unit CapEx for industrial-grade facilities sized in 2026 lands between SAR 25,000 and SAR 40,000 per m³/day of capacity. MBR trains sit toward the high end; conventional activated sludge sits lower. Coastal civil premiums of 15–20% versus inland sites often explain gaps between Al Khobar and Riyadh unit prices. Include permit and monitoring line items before comparing quotes on equipment alone.
How Much Does an MBR System Cost Compared to Conventional Activated Sludge?
MBR systems typically require 30–50% higher initial CapEx than conventional activated sludge at the same design flow. They return a footprint near 35–45% of CAS and can cut biological sludge mass by about 30%, which lowers long-run disposal cost when haul fees apply. Budget SAR 500–800 per m² for membrane replacement every 5–8 years when comparing the two options.
What Are NWC's Discharge Standards for Industrial Wastewater in Al Khobar for 2026?
The 2026 industrial targets commonly applied in Al Khobar are COD ≤100 mg/L, BOD ≤25 mg/L, TN ≤10 mg/L, TP ≤1 mg/L, and pH 6–9, with disinfection near <2.2 MPN/100 ml. Tertiary nutrient removal and disinfection are usually required to clear nitrogen, phosphorus, and pathogen limits. Confirm the current circular with NWC before freezing the process design.
Can I Finance a Wastewater Treatment Plant Through a PPP Model in Al Khobar?
Yes, NWC's LTOM programme can cover 20–30% of CapEx for qualifying plants, typically at or above 5,000 m³/day, in exchange for long-term O&M contracts of about 15–20 years. Smaller single-factory plants more often remain owner-financed with modular equipment packages and separate service agreements. Shared-facility structures inside industrial cities are the usual middle path for mid-size flows.
What Is the Typical Payback Period for a Wastewater Treatment Plant in Al Khobar?
Payback generally ranges from 5 to 10 years under current Eastern Province tariff and sludge-fee assumptions. Conventional systems often recover in 5–7 years. MBR systems commonly need 7–10 years but retain more value when TSE replaces purchased freshwater in cooling or process makeup.
What Is Industrial Wastewater Treatment Cost in Saudi Arabia in 2026?
Industrial wastewater treatment cost in Saudi Arabia in 2026 spans roughly SAR 30,000–50,000 per m³/day of CapEx at small scale and SAR 15,000–25,000 per m³/day at 10,000 m³/day. SWPC (2024) projects national wastewater volume rising from 6.85 million m³/day in 2024 to 14.10 million m³/day in 2030, keeping treatment capacity in procurement pipelines. Eastern Province coastal premiums sit above inland benchmarks because of salinity and dewatering.
What OPEX Percentage of CapEx Does a Wastewater Treatment Plant Need?
Annual OPEX for a wastewater treatment plant in Al Khobar typically runs 8–15% of installed CapEx at mid-scale. Energy takes 40–50% of that operating budget, so aeration efficiency moves the ratio more than any other line. MBR trains at the high end of the range justify themselves only when reuse value or footprint savings are real.
Do Coastal Conditions Raise the Al Khobar Wastewater Treatment Plant Cost?
Coastal conditions raise the Al Khobar wastewater treatment plant cost by about 15–20% on civil works versus comparable inland sites. High soil salinity and an elevated water table drive deeper dewatering, more protective concrete, and heavier coating specs. Modular layouts cut part of that premium by shrinking the poured-concrete scope.