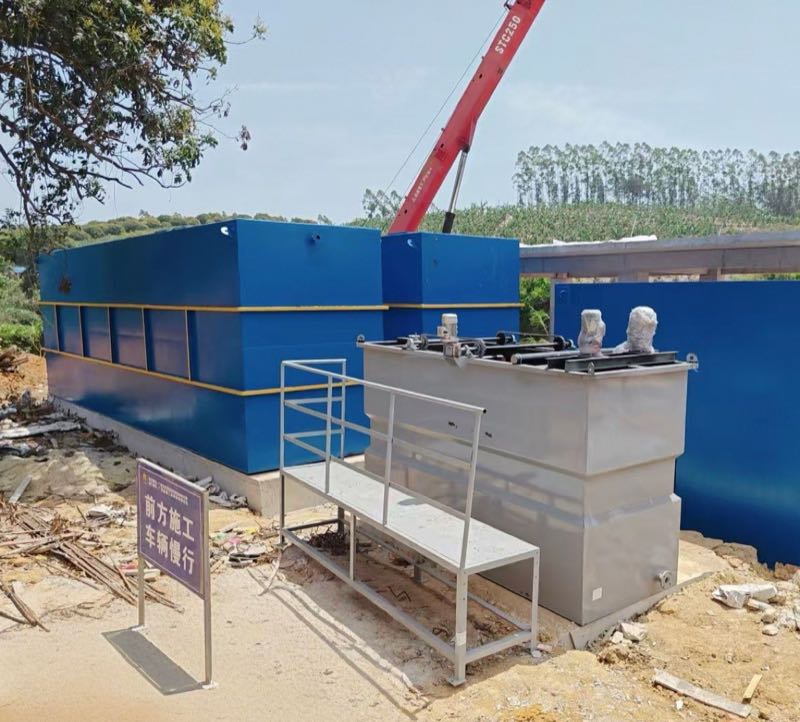
What Is the Water Management Industry?
The water management industry covers technologies and operating practices that treat, reuse, and discharge water for municipal and industrial users. Plant teams size systems by flow (m3/d), COD/TSS/TDS load, and permit limits. Core choices are pretreatment, biological treatment, membranes, disinfection, and optional zero-liquid discharge for high-salinity streams.
Industrial wastewater discharge violations rose 23% in 2023, yet only 78% of treatment plants met compliance standards. This sector spans policies, infrastructure, and equipment that keep municipal and industrial systems inside permit limits while cutting freshwater intake. Operators balance three objectives: regulatory compliance, operating cost, and measurable reuse.
The sector splits into two primary segments:
- Municipal water management: potable supply, sewage treatment, and stormwater control under rules such as the U.S. Safe Drinking Water Act (SDWA) and the EU Water Framework Directive.
- Industrial water management: process-specific needs from power-plant cooling to textile effluent. Priorities include water footprint reduction, industrial water recycling, and control of metals or PFAS. Semiconductor lines often need ultra-pure water (resistivity >18 MΩ·cm). Food processors commonly target BOD <30 mg/L before discharge or reuse.
Global spending on water infrastructure reached $800 billion in 2024, with industrial applications accounting for 42% of demand (GWI, 2024). Key drivers include:
| Driver | Impact | Industry Response |
|---|---|---|
| Regulatory Pressure | China's "Water Ten Plan" mandates 70% industrial wastewater reuse by 2025 | Adoption of MBR systems for high-efficiency filtration |
| Water Scarcity | 60% of global industrial hubs face "extreme" water stress (WRI, 2023) | Implementation of circular water economy models, e.g., zero-liquid discharge (ZLD) systems |
| ESG Reporting | 89% of Fortune 500 companies now disclose water-related risks (CDP, 2024) | Integration of smart water management platforms with real-time IoT monitoring |
Earlier commentary often framed China's Water Ten Plan as a 70% industrial wastewater reuse mandate by 2025. The 2021 Industrial Wastewater Recycling Implementation Plan instead targets about 94% reuse of scale industrial water by 2025, with textile, paper, and food plants raising reuse at least five percentage points versus 2020 (NDRC/MIIT, 2021).
Advanced oxidation processes (AOPs) can degrade recalcitrant pollutants such as 1,4-dioxane to <0.3 µg/L under controlled dose and contact time. AI-assisted predictive maintenance has cut energy use in some DAF trains by 18% versus baseline schedules. Water treatment accounts for about 4% of global electricity demand, so anaerobic digestion and membrane bioreactors remain common paths for lower-energy sustainable water infrastructure.
Key Drivers Shaping Industrial Water Systems in 2026
Industrial facilities face tighter permits, higher water prices, and ESG disclosure rules at the same time. Discharge violations climbed 23% in 2023, so plants prioritize water reuse, industrial water recycling, and sensor-based control to stay competitive across cooling, process, and utility water loops.
1. Regulatory Compliance and Stricter Enforcement
Governments continue to tighten water quality standards through instruments such as the EU Industrial Emissions Directive (IED) and China's industrial reuse programs. Facilities missing benchmarks risk fines—up to 4% of annual revenue under the EU Corporate Sustainability Reporting Directive (CSRD) in applicable cases. An MBR Membrane Bioreactor Wastewater Treatment System can reach about 95% removal of suspended solids and biodegradable organics when sized for the design COD and MLSS, supporting discharge to sensitive receiving waters.
2. Water Scarcity and the Circular Water Economy
UN assessments have long warned that large shares of the global population could face water shortages around mid-decade. Plants respond with circular water economy designs that treat and reuse effluent on site. Semiconductor sites often recycle about 70% of process water with ZLD trains, cutting freshwater withdrawal by about 50% versus once-through baselines. A Dissolved Air Flotation (DAF) System removes about 90% of emulsified oils and fine solids under typical polymer and air-to-solids ratios, preparing water for cooling-tower or boiler makeup after polishing.
3. ESG Demands and Water Footprint Reduction
Investors track water stewardship closely. CDP Water reporting in 2024 showed 62% of Fortune 500 companies disclosing water-related risks in one widely cited summary, while other CDP tallies place broader disclosure near 89%. Smart sensors have cut water waste by about 30% in textile and food plants that close control loops on flow and conductivity. Treatment energy often sits in the 3–5% band of facility electricity. A Chlorine Dioxide (ClO₂) Generator for Water Disinfection can lower chemical and energy cost versus some chlorination setups by about 20% while holding about 99.9% pathogen inactivation at correct residual and CT.
4. Technological Advancements and Smart Infrastructure
IoT and predictive analytics now support sustainable water infrastructure upgrades. Digital twins of treatment trains have reduced downtime by about 40% in published consulting benchmarks (McKinsey, 2024). Containerized modular plants can cut capital expenditure by about 25% versus comparable fixed civil works when hydraulic and load envelopes fit the skid design. Pharmaceuticals and chemicals benefit most when influent variability demands adaptive setpoints on aeration, chemical dose, and membrane flux.
| Driver | Industry Impact | Technology Enabler |
|---|---|---|
| Regulatory Compliance | Increased adoption of tertiary treatment; higher CAPEX for upgrades | MBR, DAF, Advanced Oxidation Processes (AOP) |
| Water Scarcity | Shift to closed-loop systems; ZLD adoption in high-risk regions | Reverse Osmosis, Evaporation Crystallizers |
| ESG Pressures | Water footprint reporting; investor-driven sustainability targets | IoT Sensors, AI Analytics, ClO₂ Disinfection |
| Technological Innovation | Reduced OPEX; improved process efficiency | Digital Twins, Modular Treatment Units |
Plants that pair compliance upgrades with reusable effluent grades usually lower both permit risk and makeup-water spend. Water reuse and resource recovery then become operating levers rather than one-off capital projects.
How Does Wastewater Management Work in Industry?
Wastewater management in industry starts with sector-specific loads, then matches pretreatment, biology, and polishing to reuse or discharge limits. Food, power, and textile plants illustrate the spread of COD, metals, and salinity that drive equipment choice and operating cost.
1. Food & Beverage Processing
Food processing wastewater often carries COD of 2,000–10,000 mg/L and TSS of 500–3,000 mg/L, so pretreatment is required before discharge or reuse. Dairy whey streams can exceed BOD 40,000 mg/L. Meat plants commonly show TKN of 100–500 mg/L with high blood solids that foul clarifiers if flotation is skipped.
Typical unit operations include:
- Dissolved Air Flotation (DAF): DAF trains often achieve about 95% TSS removal and 60–80% COD reduction on food loads, supporting GB 8978-1996 Class I style targets such as COD ≤100 mg/L when followed by biology.
- Membrane Bioreactors (MBR): MBR permeate turbidity <0.2 NTU is common, which suits cooling-tower or irrigation reuse after mineral checks.
- Anaerobic Digestion: Digesters convert organics to biogas (60–70% methane) and cut sludge volume by 50–70% at mesophilic HRT of several days.
| Parameter | Raw Wastewater | Post-DAF Treatment | Post-MBR Treatment |
|---|---|---|---|
| COD (mg/L) | 5,000 | 1,500 | <50 |
| TSS (mg/L) | 2,000 | 100 | <5 |
| Nitrogen (mg/L) | 300 | 250 | <10 |
2. Power Generation
Thermal power plants consume about 2–5 m³/MWh for cooling and contribute roughly 40% of global industrial water withdrawals in IEA summaries (IEA, 2023). ZLD mandates appear more often where water stress and brine limits coincide. Coal FGD wastewater may hold selenium 1–5 mg/L, mercury 0.01–0.1 mg/L, and TDS 10,000–50,000 mg/L.
Common responses include:
- Electrocoagulation (EC): EC can remove about 99% of selenium and 95% of mercury in reported industrial trials while cutting coagulant chemical use by about 30% versus conventional precipitation.
- Forward Osmosis (FO): FO can extract about 80% of water from FGD brine at energy below 0.5 kWh/m³ under favorable draw-solution recovery.
- Crystallizers: Mechanical crystallizers in ZLD trains often reach about 98% water recovery, with salt cakes checked against ASTM C979 when reuse is intended.
3. Textile Manufacturing
Textile dyeing commonly uses 100–150 L/kg fabric. UNEP has reported regions where about 80% of textile wastewater still enters receiving waters with limited treatment (UNEP, 2022). Azo dyes show BOD/COD <0.1, while chromium may reach 5–50 mg/L and TDS 2,000–10,000 mg/L.
Useful approaches include:
- Advanced Oxidation Processes (AOP): UV/H₂O₂ systems can degrade about 90% of recalcitrant dyes in about 30 minutes when radical dose matches dye load.
- Nanofiltration (NF): NF often rejects about 95% of dyes and 70% of salts, enabling rinse-water recycle.
- Bioaugmentation: Engineered consortia such as Pseudomonas putida have raised decolorization rates by about 40% versus unaugmented activated sludge in published trials.
Sector-matched trains move plants from linear discharge toward closed-loop circular water economy performance with clearer ESG evidence and lower specific intake.
Which Technologies Matter Most for Plant Upgrades?
Plant upgrade shortlists now mix digital controls with proven unit processes rather than single equipment bets. Four technology families show broad industrial adoption for reuse, compliance, and energy control.
1. AI-Driven Smart Water Management
AI platforms forecast equipment failures from sensor histories and have cut downtime by up to 40% in consulting case sets (McKinsey, 2024). Leak-detection models on pH, turbidity, and flow have reported about 98% accuracy in semiconductor utility networks when trained on site data. Representative control bands include:
| Parameter | AI Model Input | Industry Standard Threshold | AI-Optimized Threshold |
|---|---|---|---|
| Turbidity (NTU) | Real-time optical sensors | <5 NTU (EPA) | <2 NTU (90% compliance) |
| Flow Rate (m³/h) | Ultrasonic flow meters | ±10% variance | ±2% variance (predictive) |
2. Membrane Bioreactors (MBRs) for Industrial Water Recycling
MBRs combine biology with ultrafiltration and produce effluent suitable for many cooling-tower or boiler-feed reuse duties after mineral balancing. A 2023 Water Environment Federation review reported about 99.9% pathogen removal and about 30% less sludge versus conventional activated sludge under comparable BOD loads. Typical advantages include:
- Footprint reduction: about 50% smaller than conventional clarifier trains at equal capacity.
- Energy efficiency: submerged MBRs often operate at 0.4–0.6 kWh/m³, about 20% below many cross-flow layouts.
- Compliance: permeate quality can meet China's GB/T 31962-2015 reuse ranges when upstream load and membrane integrity are controlled.
3. Zero-Liquid Discharge (ZLD) Systems
ZLD recovers up to about 95% of water while concentrating solids for disposal or salt recovery. Textile ZLD trains often cut freshwater use by about 80% through three stages:
- Pre-treatment: coagulation removes about 90% of suspended solids (TSS <50 mg/L).
- Reverse osmosis: about 75% water recovery with permeate TDS <100 ppm under design recovery.
- Crystallization: evaporation ponds or mechanical vapor compression for salt recovery.
A petrochemical plant in Jiangsu Province reported 98% water recovery and 12,000 m³/year less freshwater intake after commissioning a comparable train.
4. IoT-Enabled Smart Sensors
Wireless sensors track the water-energy nexus in real time. Dissolved-oxygen control on aeration blowers has cut power by about 15% when setpoints follow actual oxygen uptake. Common applications include corrosion monitoring via pH and conductivity, chromium VI alerts in plating shops, and RFID tracking of mobile treatment skids on multi-building sites.
Together these tools strengthen sustainable water infrastructure by pairing lower OPEX with tighter permit margins as the water management industry scales reuse programs.
How to Implement a Water Management Strategy: A Step-by-Step Guide
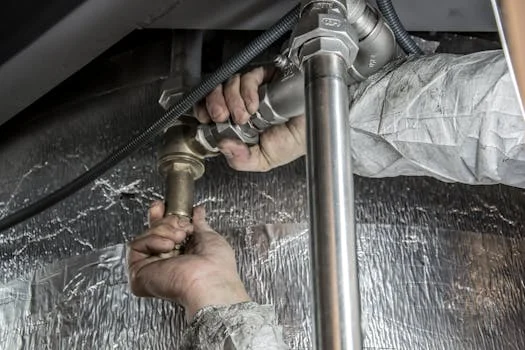
Industrial water strategies work best when they start from measured flows and end with verified KPIs. The sequence below keeps compliance, cost, and reuse targets on one shared timeline for engineering and procurement.
1. Conduct a Water Audit
Map intake, quality, and discharge with flow meters and online sensors. Facility audits still treat cooling as a major draw. Earlier guidance often listed cooling towers at 30–50% of industrial water use; US EPA WaterSense at Work states that heating and cooling mechanical systems can reach about 30% of total water use in commercial facilities (EPA WaterSense, 2023). Boilers commonly add another 10–20% of site use. Capture metrics in a shared format:
| Parameter | Measurement | Industry Benchmark | Target Reduction |
|---|---|---|---|
| Water intake (m³/ton product) | Current value | Food & Beverage: 2–5 m³/ton | 15–25% |
| Wastewater TDS (mg/L) | Current value | Textiles: 1,500–3,000 mg/L | 30–40% |
| Leakage rate (%) | Current value | <5% (best practice) | 100% elimination |
2. Set SMART Goals
Tie goals to ESG pledges and local permits. Useful targets include 30–70% recycling via closed-loop biology and membranes, a 20% cut in specific water consumption within 24 months, and alignment with ISO 14046 or EPA Effluent Guidelines for the sector.
3. Select Technologies Based on ROI
Match unit processes to audit findings. High-TDS streams often need reverse osmosis at 75–90% recovery, while DAF removes about 95% of free and emulsified solids ahead of biology. Compare CapEx and OpEx using published ranges:
| Technology | CapEx ($/m³/day) | OpEx ($/m³) | Payback Period (Years) |
|---|---|---|---|
| Membrane Bioreactor (MBR) | 1,200–2,000 | 0.30–0.60 | 3–5 |
| Electrocoagulation | 800–1,500 | 0.20–0.40 | 2–4 |
| Zero-Liquid Discharge (ZLD) | 2,500–4,000 | 0.80–1.50 | 5–8 |
For contaminant-to-equipment mapping, use the industrial wastewater treatment equipment selection guide before freezing P&IDs.
4. Integrate Smart Water Management
IoT sensors and analytics can cut chemical dosing by 15–30% and energy by about 20% when control loops are tuned (McKinsey, 2024). Prioritize predictive maintenance on pumps and membranes, automated alerts on pH or turbidity, and digital-twin trials before full set-point changes.
5. Measure and Validate ROI
Track water-use efficiency (L per unit product), $/m³ saved, and permit exceedance rate. When capacity must grow with production, the Wastewater Treatment System Sizing Guide helps align Q, HRT, and load. Annual audits and third-party schemes such as the AWS Standard strengthen disclosure packages for lenders and customers.
Selection checklist for buyers:
- Confirm design flow at peak day × 1.2–1.5 safety factor.
- List COD, TSS, oil, metals, and TDS with diurnal ranges.
- Match reuse grade to cooling, boiler, rinse, or irrigation specs.
- Budget membrane replacement and sludge disposal in OpEx.
- Verify power (kWh/m³) at local tariff before payback claims.
- Check brine or ZLD solids outlets against local disposal rules.
- Require factory acceptance tests with site-specific water.
Case Study: How a Textile Manufacturer Reduced Water Use by 40% with Smart Treatment
A textile producer in Southeast Asia faced rising water cost and tighter discharge limits. After installing a 5,000 m³/day MBR with hollow-fiber membranes (0.04 µm) and a three-stage RO reuse loop, freshwater use fell 40% while ISO 14046 reporting improved across dyeing and finishing lines.
| Parameter | Pre-Implementation | Post-Implementation | Improvement |
|---|---|---|---|
| Freshwater intake (m³/ton fabric) | 120 | 72 | 40% reduction |
| COD removal efficiency | 85% | 98% | 13% increase |
| Reuse rate | 0% | 65% | New capability |
| Energy consumption (kWh/m³) | 1.8 | 1.4 | 22% reduction |
Stable flux of 18–22 LMH held when HRT tracked dye-specific COD. Transmembrane-pressure sensors triggered cleaning early and extended membrane life by about 30%. RO permeate at TDS <50 mg/L returned to dyeing, while brine moved to electrocoagulation for ZLD compliance. Annual freshwater withdrawals fell by 1.8 million m³. Capacity planning followed the same sizing method used in the plant's engineering package for industrial and municipal loads.
Future Outlook: Predictions for Water Systems (2025–2035)
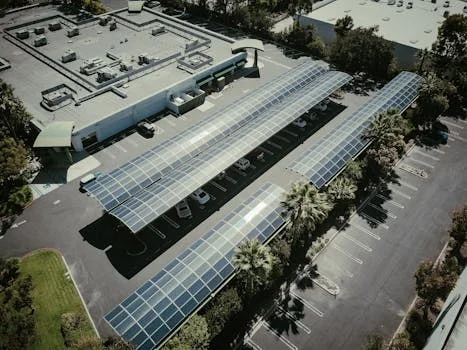
Industrial water reuse is projected to exceed 30% globally by 2035, up from about 12% in 2025 in WRI-linked outlooks (WRI, 2024). CSRD-style disclosure and China's industrial reuse programs will keep pressure on smart metering and leak detection. Forward osmosis and membrane distillation are expected to cut desalination energy by about 40% by 2030 for high-salinity industrial streams in IEA technology pathways (IEA, 2023).
Capital will concentrate on modular treatment, brine management, and water-energy nexus upgrades. Market timing context appears in the Water Treatment Equipment Market Forecast 2024–2033 for buyers comparing category growth rates before multi-year CapEx locks.
| Technology | Industry Application | Payback Period (Years) | Water Savings (%) |
|---|---|---|---|
| Closed-loop cooling systems | Power, Petrochemical | 2.5–4 | 25–35 |
| Electrocoagulation + MBR | Textile, Food & Beverage | 3–5 | 40–60 |
| Zero-liquid discharge (ZLD) | Semiconductor, Mining | 5–7 | 90–95 |
Who this is for: plant engineers, EPC contractors, and procurement managers sizing reuse or compliance upgrades for food, textile, power, or chemicals. Who should look elsewhere: households seeking residential filters, or cities needing only potable distribution design without industrial effluent loads. Next step: send influent data (flow, COD, TSS, oil, metals, TDS) for a duty-point check against MBR, DAF, or ZLD envelopes.
Cost drivers that usually dominate life-cycle models are power for aeration or high-pressure pumps, membrane replacement, sludge haulage, and chemical dose for coagulation or CIP. Ranking those four line items against local tariffs and disposal fees prevents understated OpEx when comparing MBR, DAF-plus-biology, and ZLD options on the same duty.
Document permit limits and reuse specs in the same data room as P&IDs. Procurement teams that freeze vendor lists before agreeing on effluent COD, TSS, oil, and TDS bands often reopen bids after FAT water fails the reuse grade, adding months to schedule on multi-skid projects.
Frequently Asked Questions
What are the most effective technologies for industrial water reuse?
Membrane bioreactors and dissolved air flotation commonly deliver 90–98% recovery potential when paired with RO or NF polishing for the target reuse grade. High-salinity streams often need forward osmosis or electrodialysis reversal to cut brine volume by about 70% while returning process water. Match technology to COD, metals, and TDS first, then confirm ISO 14046 style footprint metrics against the plant's disclosure scope.
How do I calculate the right capacity for a wastewater treatment system?
Size from peak daily flow, contaminant mass load, and the discharge or reuse limit that governs the train. Use a safety factor of 1.2–1.5 on peak day flow, then check BOD or COD mass (kg/d) and HRT for the selected biology. Textile example: 1,000 m³/day × 1.3 = 1,300 m³/day design flow; 500 mg/L BOD × 1,300 m³/day = 650 kg/day; MBR HRT near 6 hours is a common starting point before site pilot data.
| Parameter | Calculation | Example (Textile Plant) |
|---|---|---|
| Design Flow (Q) | Q = Peak Daily Flow × Safety Factor (1.2–1.5) | 1,000 m³/day × 1.3 = 1,300 m³/day |
| Organic Load (BOD) | BOD = Influent BOD × Q | 500 mg/L × 1,300 m³/day = 650 kg/day |
| Hydraulic Retention Time (HRT) | HRT = Reactor Volume ÷ Q | 6 hours (typical for MBR systems) |
What are the 5 R's of water management for industrial facilities?
The 5 R's are Reduce, Reuse, Recycle, Recover, and Restore. Acoustic leak detection can cut cooling-tower losses by 20–30%. Treated boiler blowdown can cover about 40% of non-potable demand in some plants. Semiconductor closed loops often recover about 95% of ultrapure water. Anaerobic digestion yields about 0.3–0.5 m³ biogas per kg COD removed. Constructed wetlands can raise local recharge by 15–25% when stormwater is routed correctly.
How will ESG rules change water management strategies through 2025?
EU Taxonomy and China ESG disclosure rules push water intensity, reuse rate, and third-party verification onto board agendas. Steel examples often target <1.5 m³/ton, while textiles and mining face rising ZLD expectations in stressed basins. Minimum industrial reuse near 30% appears in several corporate programs. IoT metering and predictive analytics become the evidence layer for those KPIs rather than annual spreadsheet estimates.
What is the first step to implement a water management plan?
Start with a water audit that maps every major user, especially cooling systems that often take 40–60% of industrial intake on heat-heavy sites. Benchmark against sector averages, then pilot one high-ROI step such as RO for boiler feed or DAF pretreatment that removes about 95% of suspended solids. Validate payback on metered data before scaling CapEx across the full site.