Home>Blog>Buyer's Guide>Reverse Osmosis vs Ultrafiltration Cost Difference: 2026 Industrial CAPEX/OPEX Breakdown & Tech-Specific ROI Calculator
Reverse Osmosis vs Ultrafiltration Cost Difference: 2026 Industrial CAPEX/OPEX Breakdown & Tech-Specific ROI Calculator
Buyer's Guide
Zhongsheng Engineering Team
Reverse Osmosis vs Ultrafiltration Cost Difference: 2025 Industrial CAPEX/OPEX Breakdown & Tech-Specific ROI Calculator
For industrial wastewater treatment, reverse osmosis (RO) systems typically cost 30–50% more in CAPEX ($0.8–1.5M for 100 m³/h) and 40–60% more in OPEX ($0.35–0.60/m³ treated) than ultrafiltration (UF) systems ($0.5–1.0M CAPEX, $0.20–0.35/m³ OPEX), due to higher energy consumption (0.5–1.5 kWh/m³ for RO vs 0.1–0.3 kWh/m³ for UF) and more frequent membrane replacement (every 2–3 years for RO vs 5–7 years for UF). However, RO achieves 99%+ TDS removal, making it essential for zero-liquid-discharge (ZLD) or reuse applications, while UF is ideal for pre-treatment or low-TDS influent.
Why Industrial Buyers Need a Cost-Focused RO vs UF Comparison
Industrial wastewater treatment projects require meticulous financial planning, often hinging on critical decisions between membrane filtration technologies like Reverse Osmosis (RO) and Ultrafiltration (UF). A textile factory in Gujarat recently faced a significant $500K budget overrun by opting for an RO system to treat a relatively low-TDS influent (300 mg/L TDS), when a UF system would have effectively met discharge limits at an estimated 40% lower overall cost. This scenario underscores the urgent need for a data-driven comparison, moving beyond generic descriptions to provide concrete industrial-scale cost insights. Compliance-driven costs are a primary factor; stringent discharge limits, such as the EPA's mandate for less than 50 mg/L Total Dissolved Solids (TDS) for certain discharge types, often necessitate RO adoption, whereas UF systems are typically sufficient for achieving high removal rates of Total Suspended Solids (TSS) and colloids, as commonly required in food processing or pulp & paper industries. Energy consumption represents a substantial, often hidden, operational cost driver for membrane systems. RO systems, with their requirement for high-pressure pumps, consume significantly more energy (0.5–1.5 kWh/m³) compared to UF systems (0.1–0.3 kWh/m³), translating to an additional $50K–$150K per year in OPEX for a typical 100 m³/h industrial facility, based on EPA 2024 benchmarks. maintenance trade-offs between the two technologies are critical. RO membranes generally require replacement every 2–3 years, incurring both material and labor costs, while UF membranes boast a longer lifespan of 5–7 years, reducing the frequency of costly interventions, including cleaning and calibration.
Reverse Osmosis vs Ultrafiltration: 2025 Industrial Cost Drivers
reverse osmosis vs ultrafiltration cost difference - Reverse Osmosis vs Ultrafiltration: 2025 Industrial Cost Drivers
The capital expenditure (CAPEX) for industrial RO systems typically ranges from $8,000–$15,000 per m³/h of capacity, while UF systems are more economical at $5,000–$10,000 per m³/h (2025 industrial benchmarks, confirmed by top industry analyses). These figures encompass the primary components, including high-pressure pumps for RO, membrane modules, pre-treatment equipment, and advanced automation and control systems. Operational expenditure (OPEX) further differentiates the technologies, with RO systems incurring $0.35–$0.60 per m³ treated, significantly higher than UF systems at $0.20–$0.35 per m³ treated (per EPA 2024 data). This difference is predominantly driven by energy consumption, chemical usage for cleaning and pre-treatment, and the more frequent replacement of RO membranes.
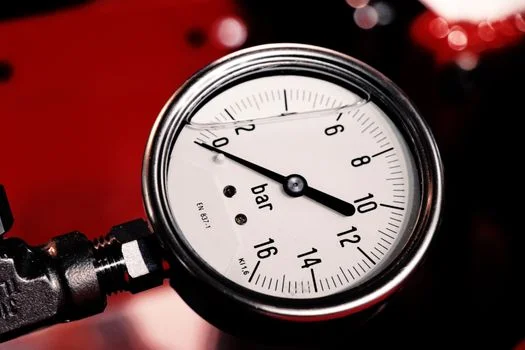
Energy consumption is a critical factor for industrial wastewater treatment cost, with RO systems demanding 0.5–1.5 kWh/m³ due to their reliance on high-pressure pumps to overcome osmotic pressure, whereas UF operates at lower pressures, consuming only 0.1–0.3 kWh/m³. To calculate the annual energy cost for a system, the formula is: Annual Energy Cost = System Capacity (m³/h) × Operating Hours/Year × Energy Consumption (kWh/m³) × Electricity Rate ($/kWh). For example, a 100 m³/h RO system operating 8,000 hours annually at $0.10/kWh could incur energy costs of $40,000–$120,000 per year.
Membrane replacement cycles also heavily influence long-term costs. RO membranes typically have a lifespan of 2–3 years, with individual replacement costs ranging from $79.50–$200 per membrane (per top industry scraped content), while UF membranes are more durable, lasting 5–7 years and costing $50–$150 per membrane. The actual lifespan of membranes is highly dependent on influent quality; for instance, influent Total Suspended Solids (TSS) exceeding 100 mg/L can reduce UF membrane life by up to 30% due to increased fouling rates.
Compliance costs are often the ultimate determinant for system selection. RO’s superior removal efficiency of 99%+ for TDS makes it indispensable for applications requiring zero-liquid-discharge (ZLD) or high-purity water reuse, common in semiconductor manufacturing or pharmaceutical production. In contrast, UF’s 90–95% TSS removal capability is sufficient for pre-treatment to other systems or for direct discharge where regulations focus on particulate matter, such as in food processing or pulp & paper industries.
RO for dissolved solids; UF for suspended solids, colloids
Primary Application
ZLD, Reuse, High-TDS influent
Pre-treatment, Low-TDS influent, TSS removal
Compliance with specific discharge limits
RO vs UF Cost Comparison Table: 100 m³/h System Benchmarks
For an industrial facility requiring a 100 m³/h wastewater treatment system, a direct comparison of Reverse Osmosis (RO) and Ultrafiltration (UF) systems reveals distinct financial profiles over their lifespan. The following table provides benchmark costs and key performance indicators based on EPA 2024 data, Zhongsheng Environmental’s case studies, and leading industry analyses. This comparison assumes an electricity cost of $0.10/kWh and a 10-year system lifespan for payback period calculations.
Parameter
Reverse Osmosis (RO) System (100 m³/h)
Ultrafiltration (UF) System (100 m³/h)
Notes
Estimated CAPEX
$1.0M
$0.7M
Includes equipment, installation, and initial setup
Estimated OPEX ($/m³)
$0.50
$0.25
Includes energy, chemicals, membrane replacement, labor
Energy Consumption (kWh/m³)
1.0
0.2
Average for industrial applications
Membrane Replacement Cycle
2.5 years
6 years
Assumes moderate influent quality
Annual Maintenance (hours/year)
200
100
Includes routine checks, cleaning, and minor repairs
Payback Period (years)
4.2
2.8
Assumes RO for TDS >500 mg/L influent, UF for TSS <100 mg/L influent
The payback period calculation highlights that UF systems typically offer a faster return on investment when they are suitable for the application's influent quality and discharge requirements. For a 100 m³/h RO system, a CAPEX of $1.0M and an OPEX of $0.50/m³ (equivalent to $438,000 annually for 8,760 operating hours) results in a longer payback. In contrast, a UF system with $0.7M CAPEX and $0.25/m³ OPEX ($219,000 annually) achieves a significantly quicker payback, making it a more attractive option where its filtration capabilities align with treatment goals.
How Influent Quality Affects RO and UF System Costs
reverse osmosis vs ultrafiltration cost difference - How Influent Quality Affects RO and UF System Costs
Influent wastewater quality directly dictates the selection and long-term operating costs of Reverse Osmosis (RO) and Ultrafiltration (UF) systems, with parameters like TDS, TSS, COD, and pH having significant impacts. When influent TDS levels consistently exceed 500 mg/L, an RO system is typically required to meet stringent discharge limits, such as the EPA's mandate of <50 mg/L TDS for certain reuse or direct discharge applications, adding an estimated $0.20–$0.30/m³ to OPEX compared to UF. High TDS can also reduce RO membrane life by 20–40% due to increased osmotic pressure and scaling potential, necessitating more frequent cleaning and replacement.
For influent with TSS greater than 100 mg/L, Ultrafiltration (UF) is often the preferred pre-treatment step to protect downstream RO membranes, reducing RO OPEX by 30–50% (per EPA 2024 data). A petrochemical plant, for example, successfully reduced its RO OPEX by 45% after integrating a UF pre-treatment stage, significantly extending RO membrane life and reducing chemical cleaning frequencies. Without effective pre-treatment, high TSS can lead to severe fouling, necessitating frequent and aggressive chemical cleaning of RO membranes, which contributes to their premature degradation. Zhongsheng Environmental’s industrial RO systems are designed to integrate seamlessly with effective pre-treatment.
Chemical Oxygen Demand (COD) levels also influence system design and cost. If influent COD exceeds 300 mg/L, RO systems may require additional pre-treatment stages, such as Dissolved Air Flotation (DAF) or Membrane Bioreactors (MBR), to prevent organic fouling, increasing CAPEX by 20–30%. UF systems, however, can often handle COD concentrations up to 500 mg/L without requiring extensive pre-treatment, offering a more cost-effective solution for moderate organic loads. For robust primary treatment to reduce TSS and COD, consider Zhongsheng Environmental’s Dissolved Air Flotation (DAF) machines.
Extreme pH levels (pH <3 or >11) can accelerate the degradation of RO membranes, requiring the installation of pH adjustment systems, which can add $50K–$100K to CAPEX. UF membranes, in contrast, generally tolerate a broader pH range of 2–13 without significant degradation or the need for costly pH adjustment, simplifying operation and reducing chemical consumption. For precise pH control and membrane protection, an automatic chemical dosing system is essential.
Influent Parameter
Typical Range
Recommended System
Estimated Cost Impact (vs. baseline)
Notes
Total Dissolved Solids (TDS)
<500 mg/L
UF or UF + polishing
UF: Lower CAPEX/OPEX
UF sufficient for TSS/colloid removal
>500 mg/L
RO or UF + RO
RO: Higher CAPEX/OPEX (+$0.20–$0.30/m³ OPEX)
RO required for TDS compliance, ZLD, reuse
Total Suspended Solids (TSS)
<100 mg/L
UF (primary for TSS)
UF: Cost-effective TSS removal
Protects downstream systems, extends membrane life
>100 mg/L
Pre-treatment (e.g., DAF) + UF
Increased CAPEX for pre-treatment
Reduces UF/RO fouling, extends membrane life
Chemical Oxygen Demand (COD)
<300 mg/L
UF (can handle)
UF: No additional pre-treatment usually needed
UF effective for moderate organic loads
>300 mg/L
Pre-treatment (e.g., MBR, DAF) + RO
RO: +20–30% CAPEX for pre-treatment
Prevents organic fouling of RO membranes
pH
3–11
UF (tolerant)
UF: Minimal pH adjustment cost
UF membranes tolerate wider pH range
<3 or >11
RO (requires adjustment)
RO: +$50K–$100K CAPEX for pH adjustment
Protects RO membranes from degradation
ROI Calculator: Which System Pays Back Faster for Your Application?
Determining the most cost-effective membrane filtration system for industrial wastewater treatment requires a precise calculation of Return on Investment (ROI), factoring in site-specific parameters. This ROI calculator provides a simplified framework for comparing the payback periods of RO and UF systems, allowing industrial buyers to input their specific operational data.
To use the calculator, gather the following key inputs:
System Capacity: Your required flow rate in m³/h.
Influent TDS: Average Total Dissolved Solids in mg/L.
Influent TSS: Average Total Suspended Solids in mg/L.
Electricity Cost: Your local electricity rate in $/kWh.
Labor Cost: Average hourly labor rate for maintenance in $/hour.
Membrane Replacement Cost: Average cost per RO or UF membrane ($/membrane).
Operating Hours: Annual operating hours of the system (e.g., 8,000 hours/year).
The core formulas for calculating CAPEX, OPEX, and Payback Period are:
CAPEX (System) = (RO/UF Cost per m³/h capacity) × System Capacity (m³/h)
Annual Energy Cost = System Capacity (m³/h) × Operating Hours/Year × Energy Consumption (kWh/m³) × Electricity Rate ($/kWh)
Annual OPEX (System) = Annual Energy Cost + Annual Membrane Replacement Cost + Annual Labor Cost + Chemical Costs
Payback Period (Years) = CAPEX (System) / (Annual OPEX Savings vs. Baseline or Revenue Generated by Reuse)
Consider an example for a 50 m³/h system, operating 8,000 hours annually, with 800 mg/L TDS influent, $0.12/kWh electricity, and $25/hour labor:
RO System: Assuming a CAPEX of $600,000 (avg. $12,000/m³/h) and an OPEX of $0.50/m³ (energy: 1.0 kWh/m³), the annual OPEX would be approximately $200,000. If this RO enables a $150,000 annual saving from water reuse, its payback period would be around 4.0 years.
UF System: If UF were suitable for the application (e.g., pre-treatment or low-TDS discharge requirements), with a CAPEX of $350,000 (avg. $7,000/m³/h) and an OPEX of $0.25/m³ (energy: 0.2 kWh/m³), the annual OPEX would be around $100,000. If UF also enables $100,000 in annual savings (e.g., reduced discharge fees), its payback would be approximately 3.5 years.
*Note: This example simplifies the payback calculation for clarity. A full ROI calculation would include all OPEX components and potential revenue generation or cost savings from treated water.*
To facilitate your specific project evaluation, we provide a downloadable ROI spreadsheet template. This tool allows you to plug in your actual system capacity, influent quality, and local cost data to generate a customized payback period for both RO and UF options. Please note that this calculator assumes a 10-year system lifespan, does not account for financing costs, and simplifies membrane fouling as linear for estimation purposes.
Frequently Asked Questions
reverse osmosis vs ultrafiltration cost difference - Frequently Asked Questions
How much does a 100 m³/h RO system cost?
A 100 m³/h Reverse Osmosis (RO) system typically requires a Capital Expenditure (CAPEX) between $800,000 and $1.5 million, which includes the cost of high-pressure pumps, RO membranes, pre-treatment modules, and advanced automation systems. The Operational Expenditure (OPEX) for such a system generally ranges from $0.35 to $0.60 per m³ treated. Energy consumption is the largest component of OPEX, accounting for 60–70% of costs, due to the high-pressure requirements of RO, as detailed in EPA 2024 benchmarks.
Can UF replace RO for industrial wastewater treatment?
Ultrafiltration (UF) can replace Reverse Osmosis (RO) for industrial wastewater treatment applications where the influent Total Dissolved Solids (TDS) is consistently below 500 mg/L and discharge limits for TDS are less stringent (e.g., above 50 mg/L). UF is highly effective at removing suspended solids, colloids, bacteria, and viruses, making it suitable for pre-treatment to other systems or for direct discharge in industries like food processing or pulp & paper. However, for applications requiring high TDS removal (e.g., >500 mg/L influent TDS), zero-liquid-discharge (ZLD), or high-purity water reuse, RO remains essential due to its superior ability to remove dissolved salts and small molecules (per Top 2 scraped content).
What’s the energy consumption difference between RO and UF?
The energy consumption difference between RO and UF is significant for industrial applications. Reverse Osmosis (RO) systems consume between 0.5–1.5 kWh/m³ of treated water due to the high pressures required to overcome osmotic pressure. In contrast, Ultrafiltration (UF) systems operate at much lower pressures and typically consume only 0.1–0.3 kWh/m³. For a 100 m³/h system operating continuously, this translates to annual energy costs of $50,000–$150,000 for RO compared to $10,000–$30,000 for UF, assuming an average electricity rate of $0.10/kWh. This disparity makes energy a critical factor in the overall OPEX comparison.
How often do RO and UF membranes need replacement?
Reverse Osmosis (RO) membranes generally require replacement every 2–3 years, with individual membrane costs ranging from $79.50 to $200. Ultrafiltration (UF) membranes typically have a longer lifespan, lasting 5–7 years, and cost between $50 and $150 per membrane. The actual lifespan for both membrane types is heavily influenced by influent water quality, particularly the levels of Total Suspended Solids (TSS) and organic fouling potential. For instance, influent TSS exceeding 100 mg/L can reduce UF membrane life by up to 30%, while high TDS or COD can similarly impact RO membrane longevity, necessitating more frequent and costly replacements.
What are the compliance implications of choosing UF over RO?
Choosing Ultrafiltration (UF) over Reverse Osmosis (RO) carries significant compliance implications, primarily concerning discharge limits for dissolved solids and specific contaminants. While UF excels at removing suspended solids, colloids, and microorganisms, it may not meet stringent discharge limits for Total Dissolved Solids (TDS), which are often set below 50 mg/L, or for specific dissolved contaminants like heavy metals or salts. RO, with its 99%+ TDS removal efficiency, is typically required for meeting these strict regulations, as well as for zero-liquid-discharge (ZLD) applications, water reuse, or treating high-TDS influent. Failure to meet discharge limits can result in substantial fines, operational shutdowns, and severe reputational damage, as stipulated by regulatory bodies such as the EPA and the EU Urban Waste Water Directive 91/271/EEC. Considerations for specific contaminants like heavy metals may also require supplementary treatment such as ion exchange for nickel wastewater treatment.
Our team of wastewater treatment engineers has over 15 years of experience designing and manufacturing DAF systems, MBR bioreactors, and packaged treatment plants for clients in 30+ countries worldwide.