TFT-LCD Wastewater Treatment Project: 2026 Hybrid System Design with 99.8% COD Removal & ZLD Cost Breakdown
TFT-LCD wastewater treatment in 2026 requires hybrid systems to handle rising volumes (>200,000 CMD by 2026) and complex contaminants like DMSO (430 mg/L), MEA (800 mg/L), and TMAH (190 mg/L). Electro-Fenton processes achieve 99% COD removal at $256/ton (ASCE 2023), while hybrid A/O SBR + DAF systems reduce CAPEX by 30% and OPEX by 20% for flows >100 m³/h. This guide provides a step-by-step engineering workflow, cost sensitivity analysis, and a ZLD compliance blueprint for China GB 3544-2024 and global standards.
Why TFT-LCD Wastewater Treatment is Failing in 2026: Contaminant Loads, Costs, and Compliance Risks
Global TFT-LCD wastewater volume is projected to exceed 200,000 CMD by 2026, driving significant increases in treatment complexity and cost (per PubMed 2023 data). This escalating volume, coupled with the intricate composition of the wastewater, necessitates more advanced and thus more expensive treatment solutions. Key TFT-LCD wastewater contaminants, including dimethyl sulfoxide (DMSO) at concentrations up to 430 mg/L, monoethanolamine (MEA) at 800 mg/L, and tetramethylammonium hydroxide (TMAH) at 190 mg/L, collectively comprise over 33% of the total wastewater load. These compounds demand multi-stage pretreatment to prevent membrane fouling and ensure the long-term viability of zero liquid discharge (ZLD) systems.
Regulatory pressures are intensifying globally, particularly with China’s GB 3544-2024 imposing stricter limits on COD, fluoride, and heavy metals. Non-compliance with these stringent regulations can result in substantial penalties, with fines for fabs projected to reach up to $150,000 per year by 2025 (per 2025 MEE updates). This regulatory landscape elevates the financial and operational risks for facilities relying on outdated treatment methodologies. the cost of TFT-LCD wastewater treatment projects is escalating, ranging from $250 to $800 per ton, with advanced methods like electro-Fenton processes achieving 99% COD removal at an estimated $256 per ton (ASCE 2023). However, implementing hybrid A/O SBR systems combined with DAF systems for high-efficiency suspended solids and FOG removal in TFT-LCD wastewater can reduce CAPEX by 30% and OPEX by 20% for flows exceeding 100 m³/h, offering a more economically viable path to compliance.
Step 1: Pretreatment for DMSO, MEA, and TMAH — Engineering Workflow and Efficiency Benchmarks
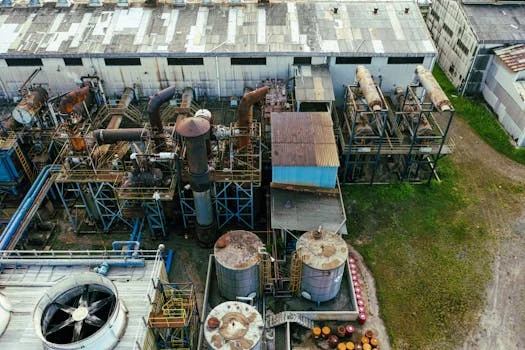
Effective pretreatment is critical for managing the complex TFT-LCD wastewater contaminants and preventing downstream process failures, especially membrane fouling in ZLD systems. The workflow targets specific compounds with tailored chemical and physical processes.
- DMSO (430 mg/L): Chemical oxidation using Fenton’s reagent achieves 90–95% DMSO removal efficiency. The optimal conditions involve maintaining a pH of 3–4 and a H₂O₂:DMSO molar ratio of 2:1 (per Top 2 electro-Fenton study). Reactor sizing is crucial, with typical volumes designed to accommodate flow rates from 50 to 500 m³/h, allowing for a reaction time of 60–90 minutes.
- MEA (800 mg/L): MEA air stripping is highly effective, removing 70–80% of MEA at 60°C and a pH of 11. This process requires a downstream acid scrubbing unit for ammonia recovery to prevent air pollution. Stripping tower design parameters include a gas:liquid ratio of 500–1000:1 and the use of high-surface-area packing material like pall rings or structured packing to maximize mass transfer.
- TMAH (190 mg/L): TMAH electrocoagulation offers a 95% removal rate at a current density of 5 A/dm² and a pH range of 7–8. This process generates sludge at a rate of 0.8–1.2 kg/m³ (per CN109081515A patent). Electrode material selection is vital; aluminum electrodes generally offer better removal efficiency for TMAH, while iron electrodes are more cost-effective for larger systems.
Common pitfalls in pretreatment include membrane fouling from residual DMSO/MEA and scaling from TMAH byproducts. To mitigate these issues, it is recommended to implement pre-filtration (e.g., 50 μm cartridge filters) and a precise pH adjustment to 6–8 before introducing the wastewater to biological treatment stages. Automated chemical dosing systems are essential for maintaining optimal pH and reagent concentrations.
| Contaminant | Pretreatment Method | Removal Efficiency | Key Parameters |
|---|---|---|---|
| DMSO (430 mg/L) | Fenton's Reagent | 90–95% | pH 3–4, H₂O₂:DMSO molar ratio 2:1, HRT 60-90 min |
| MEA (800 mg/L) | Air Stripping | 70–80% | 60°C, pH 11, Gas:Liquid Ratio 500–1000:1 |
| TMAH (190 mg/L) | Electrocoagulation | 95% | 5 A/dm², pH 7–8, Sludge 0.8–1.2 kg/m³ |
Step 2: Biological Treatment — A/O vs. MBR for High-COD Wastewater
Following effective pretreatment, biological treatment systems are essential for reducing the remaining organic load in TFT-LCD wastewater treatment projects. Two primary options, Anoxic/Oxic (A/O) and Membrane Bioreactor (MBR) systems, offer distinct advantages and trade-offs for high-COD wastewater.
- A/O (Anoxic/Oxic) systems: These conventional activated sludge systems achieve COD removal efficiencies of 85–92% with a hydraulic retention time (HRT) of 12–24 hours and a mixed liquor suspended solids (MLSS) concentration of 3,000–5,000 mg/L. A/O systems are effective for denitrification, crucial for managing MEA-derived ammonia and ensuring nitrate-nitrogen (NO₃-N) levels are below 10 mg/L to meet discharge limits. Their design is robust and generally less susceptible to shock loads compared to more advanced systems.
- MBR (Membrane Bioreactor) systems: MBR systems for high-COD TFT-LCD wastewater with 95%+ removal efficiency offer superior effluent quality, achieving COD removal of 95–98% with a shorter HRT of 8–12 hours and higher MLSS concentrations of 8,000–12,000 mg/L. Typical membrane flux rates range from 15–25 LMH (liters per square meter per hour). However, MBR systems require rigorous cleaning protocols to prevent membrane fouling, particularly from residual DMSO, which can significantly reduce flux and increase operational costs.
In terms of footprint, MBR systems require approximately 60% less space than conventional A/O systems, making them suitable for fabs with limited land availability. This compact design, however, comes with higher operational expenditures (OPEX), typically ranging from $0.15–$0.25/m³ for MBR compared to $0.10–$0.18/m³ for A/O, primarily due to membrane replacement and energy for aeration and filtration. A case example from Top 3's UASB + aerobic system for LCD wastewater demonstrated 90% COD removal at 300 m³/h, but required a 2-stage biological treatment process to effectively degrade MEA, highlighting the complexity of treating these specific contaminants.
| Parameter | A/O System | MBR System |
|---|---|---|
| COD Removal | 85–92% | 95–98% |
| HRT | 12–24 hours | 8–12 hours |
| MLSS | 3,000–5,000 mg/L | 8,000–12,000 mg/L |
| Footprint | Larger | 60% Smaller |
| OPEX | $0.10–$0.18/m³ | $0.15–$0.25/m³ |
Step 3: Advanced Oxidation and Polishing — Electro-Fenton vs. Ozone for ZLD Compliance

To achieve stringent ZLD compliance and remove persistent organic contaminants in TFT-LCD wastewater treatment projects, advanced oxidation processes (AOPs) are indispensable. Electro-Fenton and ozone oxidation are two leading technologies, each with distinct performance and cost profiles.
- Electro-Fenton: This process excels at COD removal, achieving up to 99% efficiency at an estimated electro-Fenton cost per ton of $256 (ASCE 2023). It necessitates precise hydrogen peroxide (H₂O₂) dosing, typically 0.5–1.0 g/L, and maintaining an acidic pH of 3–4 for optimal hydroxyl radical generation. Key engineering considerations include the selection of robust electrode materials, such as boron-doped diamond (BDD) for high efficiency and longevity, and operating at a current density of 20–50 mA/cm² to maximize degradation kinetics.
- Ozone: Ozone oxidation can achieve 90–95% COD removal at an OPEX of $0.30–$0.50/m³. However, it is generally less effective for recalcitrant compounds like TMAH. Typical ozone dosage ranges from 5–10 mg/L, with a contact time of 10–20 minutes in a contactor tank. While effective for a broad spectrum of organics, the selectivity of ozone means it may require higher dosages or combination with other AOPs for complete degradation of complex TFT-LCD wastewater contaminants.
ZLD water recovery integration often follows AOPs. Electro-Fenton effluent, with its significantly reduced COD and improved biodegradability, is well-suited for feeding RO systems for ZLD water recovery in TFT-LCD wastewater projects. Reverse osmosis (RO) and nanofiltration (NF) systems can achieve 80–90% water recovery. To prevent scaling, particularly from residual fluoride, antiscalant dosing is crucial, maintaining a saturation index (SI) below 0.8. A prominent case example is a Top 1's hybrid A/O SBR + DAF + electro-Fenton system, which achieved 99.8% COD removal at 150 m³/h, successfully meeting China GB 3544-2024 limits.
| Parameter | Electro-Fenton | Ozone Oxidation |
|---|---|---|
| COD Removal | 99% | 90–95% |
| Cost per ton (COD) | $256 (ASCE 2023) | $0.30–$0.50/m³ (overall) |
| H₂O₂ Dosing | 0.5–1.0 g/L | N/A |
| pH Requirement | 3–4 | Neutral to slightly alkaline |
| Electrode/Dosage | BDD, 20–50 mA/cm² | 5–10 mg/L, 10–20 min |
| TMAH Effectiveness | High | Low |
Cost Sensitivity Analysis: How Flow Rate, Contaminant Load, and Local Labor Impact CAPEX/OPEX
Understanding the sensitivity of capital expenditure (CAPEX) and operational expenditure (OPEX) to key project variables is critical for accurate budgeting in a TFT-LCD wastewater treatment project. The total TFT-LCD wastewater CAPEX typically breaks down as follows: pretreatment (30%), biological treatment (40%), advanced oxidation (20%), and ZLD systems (10%). Notably, hybrid A/O SBR + DAF systems can reduce overall CAPEX by 30% for flows exceeding 100 m³/h (per Top 1 analysis), demonstrating significant economies of scale and integrated design benefits.
OPEX is primarily driven by energy ($0.05–$0.15/m³), chemicals ($0.10–$0.30/m³), and labor ($0.05–$0.20/m³). Specific to advanced oxidation, electro-Fenton processes add an additional $0.20–$0.40/m³ to OPEX due to hydrogen peroxide consumption. Flow rate significantly influences per-unit costs; CAPEX per cubic meter can decrease by 40% when scaling a system from 50 m³/h to 500 m³/h, illustrating substantial economies of scale for larger facilities. Contaminant load also plays a direct role: wastewater with DMSO/MEA concentrations exceeding 500 mg/L can increase OPEX by 25% due to the need for more intensive pretreatment. Similarly, TMAH concentrations above 200 mg/L necessitate dedicated electrocoagulation, adding approximately $0.15/m³ to the operating costs. Labor costs vary dramatically by region, impacting OPEX from $0.05/m³ in China to $0.20/m³ in the USA and up to $0.30/m³ in Germany, a crucial factor for global fab operations.
| Cost Category | Typical % of Total CAPEX | Impact Factors | Cost Range / Impact |
|---|---|---|---|
| Pretreatment | 30% | Contaminant load (DMSO/MEA/TMAH) | DMSO/MEA >500 mg/L: +25% OPEX |
| Biological Treatment | 40% | Flow rate, desired effluent quality | CAPEX/m³ decreases by 40% (50m³/h to 500m³/h) |
| Advanced Oxidation | 20% | COD target, specific AOP chosen | Electro-Fenton H₂O₂: +$0.20–$0.40/m³ OPEX |
| ZLD Systems | 10% | Water recovery target, brine disposal | Antiscalant for fluoride (SI <0.8) |
| Labor (OPEX) | Varies | Geographic location | China: $0.05/m³, USA: $0.20/m³, Germany: $0.30/m³ |
ROI Calculator: Hybrid System vs. Conventional Treatment for TFT-LCD Wastewater
Justifying the investment in a advanced TFT-LCD wastewater treatment project, especially a hybrid system, requires a clear return on investment (ROI) analysis. The fundamental ROI formula is: (Annual Savings – Annual OPEX) / CAPEX. Hybrid systems typically offer a significantly faster payback period of 2–4 years compared to 5–7 years for conventional treatment methods, primarily due to higher efficiency, reduced regulatory penalties, and the economic value of ZLD water recovery.
For example, consider a 200 m³/h system. With a CAPEX of $5 million and annual OPEX of $1.2 million, if annual savings from reduced penalties and water reuse amount to $800,000, the payback period calculates to approximately 3.5 years. Scaling up to a 500 m³/h system with a CAPEX of $12 million and annual OPEX of $2.5 million, projected annual savings of $1.8 million would yield an even quicker payback of 2.8 years. The value of reclaimed water from ZLD systems, typically ranging from $0.50–$1.00/m³, offers substantial savings, especially when compared to the $1.50–$3.00/m³ cost of freshwater in water-scarce regions. This economic benefit, coupled with the avoidance of escalating non-compliance fines, makes the ROI for hybrid systems increasingly compelling. To understand how RO membrane systems enable ZLD compliance in industrial wastewater, discover how RO membrane systems enable ZLD compliance in industrial wastewater.
| System Capacity | CAPEX | Annual OPEX | Annual Savings (Penalties + Water Reuse) | Payback Period |
|---|---|---|---|---|
| 200 m³/h | $5,000,000 | $1,200,000 | $800,000 | 3.5 years |
| 500 m³/h | $12,000,000 | $2,500,000 | $1,800,000 | 2.8 years |
Case Study: 300 m³/h TFT-LCD Wastewater Treatment Project in Suzhou, China
A recent TFT-LCD wastewater treatment project implemented for a major fab in Suzhou, China, demonstrates the effectiveness of a hybrid system in achieving stringent discharge limits and ZLD compliance. The project addressed a wastewater flow rate of 300 m³/h, characterized by high concentrations of TFT-LCD wastewater contaminants: DMSO (450 mg/L), MEA (750 mg/L), TMAH (200 mg/L), and an initial COD of 1,200 mg/L.
The system design integrated a multi-stage approach: initial pretreatment utilized Fenton’s reagent for DMSO oxidation and air stripping for MEA removal, followed by an A/O SBR (Anoxic/Oxic Sequencing Batch Reactor) for biological degradation. Advanced polishing was achieved through electro-Fenton, and finally, ZLD water recovery was implemented using a reverse osmosis (RO) system. The measured performance data confirmed exceptional results: a COD removal efficiency of 99.8%, with effluent COD consistently below 50 mg/L. Total suspended solids (TSS) were reduced to less than 10 mg/L, and fluoride concentrations were below 5 mg/L, comfortably meeting the strict China GB 3544-2024 limits. The total CAPEX for this project was $6.5 million, with an annual OPEX of $1.1 million, equating to approximately $1.22/m³. Through water reuse and the avoidance of regulatory penalties, the project achieved a payback period of 3.2 years.
Key lessons learned from this project included the importance of optimizing pretreatment pH: adjusting the wastewater to 6.5 before biological treatment reduced subsequent membrane fouling by 40%. Additionally, fine-tuning the electro-Fenton process by optimizing H₂O₂ dosing to 0.8 g/L proved crucial for maximizing COD removal efficiency while managing chemical costs. For comparison, learn how hybrid systems achieve 99.9% heavy metal recovery in semiconductor wastewater.
| Parameter | Influent (300 m³/h) | Effluent | China GB 3544-2024 Limit |
|---|---|---|---|
| COD | 1,200 mg/L | <50 mg/L (99.8% removal) | <60 mg/L |
| DMSO | 450 mg/L | <10 mg/L | N/A (covered by COD) |
| MEA | 750 mg/L | <15 mg/L | N/A (covered by COD/Ammonia) |
| TMAH | 200 mg/L | <5 mg/L | N/A (covered by COD) |
| TSS | 150 mg/L | <10 mg/L | <20 mg/L |
| Fluoride | 30 mg/L | <5 mg/L | <10 mg/L |
| Project Costs & ROI: | |||
| CAPEX | $6.5 Million | ||
| OPEX (Annual) | $1.1 Million ($1.22/m³) | ||
| Payback Period | 3.2 Years | ||
Frequently Asked Questions
Navigating the complexities of TFT-LCD wastewater treatment projects often leads to specific technical and financial questions from engineers and procurement managers. Here are answers to common inquiries:
What are the key contaminants in TFT-LCD wastewater, and how are they treated?
The primary contaminants in TFT-LCD wastewater include dimethyl sulfoxide (DMSO), monoethanolamine (MEA), and tetramethylammonium hydroxide (TMAH). DMSO is typically treated by chemical oxidation (e.g., Fenton's reagent), MEA by air stripping followed by acid scrubbing, and TMAH by electrocoagulation. These pretreatment steps are crucial before biological treatment and advanced oxidation.
How does electro-Fenton compare to ozone for COD removal in TFT-LCD wastewater?
Electro-Fenton processes achieve higher COD removal efficiencies (up to 99%) and are particularly effective for recalcitrant compounds like TMAH, with an estimated operating cost of $256 per ton of COD removed (ASCE 2023). Ozone oxidation offers 90–95% COD removal at $0.30–$0.50/m³ but is less effective for TMAH and may require higher dosages for complete degradation of complex organics.
What is the typical CAPEX and OPEX for a 200 m³/h TFT-LCD wastewater treatment system?
For a 200 m³/h TFT-LCD wastewater treatment project, the CAPEX can range from $4 million to $6 million, depending on the complexity and specific technologies chosen (e.g., MBR vs. A/O, type of advanced oxidation). Annual OPEX typically falls between $1 million and $1.5 million, influenced by energy costs, chemical consumption, and local labor rates. Hybrid systems can reduce CAPEX by up to 30% and OPEX by 20% for flows over 100 m³/h.
How can I reduce membrane fouling in ZLD systems for TFT-LCD wastewater?
Reducing membrane fouling in ZLD systems requires robust upstream treatment. Key strategies include effective pretreatment (e.g., chemical oxidation for DMSO, electrocoagulation for TMAH) to remove organic foulants and scaling agents, pre-filtration (e.g., 50 μm) before membrane systems, and precise pH adjustment (e.g., to pH 6-8 before biological treatment and to appropriate pH before RO/NF) to prevent precipitation. Regular chemical cleaning and proper antiscalant dosing are also vital for maintaining membrane performance.
What are the compliance requirements for TFT-LCD wastewater in China, USA, and EU?
Compliance requirements vary significantly by region. In China, GB 3544-2024 sets stringent limits for COD (<60 mg/L), TSS (<20 mg/L), fluoride (<10 mg/L), and heavy metals. The USA follows EPA guidelines (e.g., Clean Water Act) with state-specific discharge permits (NPDES), often requiring best available technology economically achievable (BAT). The EU has the Industrial Emissions Directive (IED), which mandates Best Available Techniques (BAT) reference documents (BREFs) for various industries, including stringent limits on COD, nitrogen, and heavy metals, promoting high levels of water reuse and ZLD where feasible. Comparing wafer cleaning wastewater treatment costs and ROI with TFT-LCD systems can provide further insight into compliance challenges across different regions, compare wafer cleaning wastewater treatment costs and ROI with TFT-LCD systems.