In 2025, wastewater treatment plant costs in Tamil Nadu range from ₹12 lakhs for a 50 KLD package plant to ₹45 lakhs for 500 KLD, with industrial ETPs averaging ₹25,000–₹30,000 per KL flow per day. Costs are split into 25% planning/design, 60% implementation, and 15% operation and maintenance (O&M). TNPCB compliance (BOD < 10 mg/L, TSS < 20 mg/L) is mandatory, and package plants offer 30–40% lower capital costs than conventional systems. Use this guide to compare technologies, calculate ROI, and evaluate suppliers for your project in Chennai, Coimbatore, or Madurai.
Why Tamil Nadu’s Wastewater Treatment Costs Are Rising in 2025
Tamil Nadu’s stringent environmental regulations, driven by the TNPCB’s intensified enforcement, are compelling industries to invest significantly in advanced wastewater treatment. In 2023–24, the TNPCB issued 127 closure notices to industrial units in Coimbatore and Tirupur for non-compliance, highlighting the severe consequences of inadequate effluent management (TNPCB Annual Report 2023–24). This regulatory pressure, coupled with increasing operational costs, makes understanding the full financial scope of wastewater treatment plant cost in Tamil Nadu critical for any industrial or municipal project.
For instance, textile dyeing units in Erode, a region historically challenged by pollution, have successfully reduced their Biochemical Oxygen Demand (BOD) from 300+ mg/L to below 10 mg/L by adopting modern package plants, effectively avoiding penalties and ensuring operational continuity. Key cost drivers influencing this upward trend include land scarcity, with industrial zones demanding ₹5,000–₹15,000 per square meter, and a significant 20% year-over-year increase in skilled labor costs across Tamil Nadu. Material inflation, particularly for steel, which saw an 18% rise in 2024, further pushes up the capital expenditure for new installations. TNPCB’s 2024 enforcement drive is accelerating the adoption of modular, skid-mounted systems that offer faster deployment and a smaller footprint, helping mitigate some land-related costs while meeting stringent discharge norms.
Wastewater Treatment Plant Cost Breakdown: CAPEX vs. OPEX for Tamil Nadu Projects
Accurate budgeting for a wastewater treatment plant in Tamil Nadu requires a clear distinction between Capital Expenditure (CAPEX) and Operational Expenditure (OPEX), as these components dictate the total cost of ownership over the plant's lifecycle. For a typical 200 KLD industrial Effluent Treatment Plant (ETP), the CAPEX can total approximately ₹1.85 Crores, breaking down into ₹1.2 Crores for core equipment, ₹30 Lakhs for civil works, ₹20 Lakhs for installation, and ₹15 Lakhs for commissioning. This implementation phase accounts for the largest portion of the initial investment.
Conversely, OPEX comprises recurring costs essential for day-to-day operation. These include power consumption (ranging from ₹8–₹12 per KL of treated water), chemical usage (₹3–₹7 per KL), labor (₹2–₹5 per KL), and routine maintenance (₹1–₹3 per KL). While automation can increase CAPEX by 15–20% due to advanced controls and sensors, it typically reduces OPEX by 25–30% through optimized energy consumption, reduced chemical dosing, and lower labor requirements. For projects considering skid-mounted treatment plants, initial CAPEX can be 30–40% lower than conventional systems, though civil work savings might be offset by higher equipment costs for compact designs.
The overall cost distribution for a wastewater treatment plant in Tamil Nadu is typically segmented into three main phases:
| Cost Component | % of Total Cost | 100 KLD Plant (Indicative Total ₹) | 500 KLD Plant (Indicative Total ₹) |
|---|---|---|---|
| Planning & Design | 25% | ₹38.5 Lakhs | ₹1.93 Crores |
| Implementation (CAPEX) | 60% | ₹92.5 Lakhs | ₹4.63 Crores |
| Operation & Maintenance (1st year OPEX) | 15% | ₹23.1 Lakhs | ₹1.16 Crores |
| Total Indicative Cost (1st year) | 100% | ₹1.54 Crores | ₹7.72 Crores |
Note: These figures are illustrative and can vary significantly based on the chosen technology, effluent characteristics, site-specific conditions, and the extent of automation.
Technology Comparison: MBBR vs. SBR vs. MBR for Tamil Nadu’s Wastewater
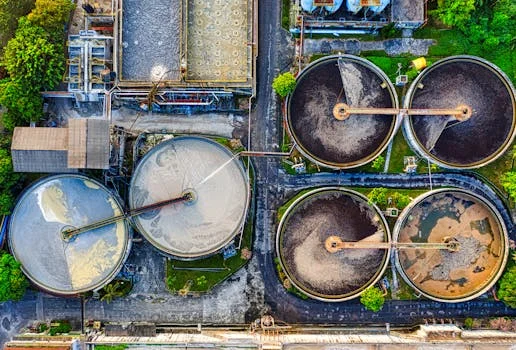
Selecting the appropriate wastewater treatment technology is paramount for meeting TNPCB compliance while optimizing both capital and operational costs in Tamil Nadu. Three leading biological treatment options are Moving Bed Biofilm Reactors (MBBR), Sequencing Batch Reactors (SBR), and Membrane Bioreactors (MBR).
- MBBR (Moving Bed Biofilm Reactor): MBBR systems are characterized by their compact design, typically requiring up to 60% less footprint than conventional activated sludge systems. They achieve COD removal efficiencies of 85–95% and are ideal for space-constrained sites, such as industrial parks in Chennai. The CAPEX for MBBR systems ranges from ₹30 Lakhs to ₹3 Crores for capacities between 50 KLD and 500 KLD. OPEX is moderate, primarily driven by aeration and media replacement every 10-15 years.
- SBR (Sequencing Batch Reactor): SBR technology offers a lower CAPEX compared to MBBR, with costs typically between ₹25 Lakhs and ₹2 Crores for 50–500 KLD plants. However, SBR systems generally require a larger footprint and more skilled operators due to their batch operational nature. They are often best suited for municipal projects in Coimbatore or industrial applications with variable flow rates, achieving COD removal rates of 80–90%.
- MBR (Membrane Bioreactor): MBR membrane bioreactor systems deliver near-reuse quality effluent, capable of achieving over 95% contaminant removal and TSS levels below 5 mg/L, significantly outperforming SBR systems which typically yield 20–30 mg/L TSS (per EPA 2024 benchmarks). While MBR offers a very compact footprint and superior effluent quality (<1 μm filtration), it comes with a higher CAPEX (₹50 Lakhs–₹5 Crores for 50–500 KLD) and higher OPEX, mainly due to membrane replacement every 5–7 years and increased energy consumption for filtration. MBR is ideal for industries aiming for zero liquid discharge (ZLD) or water reuse applications. To compare MBR and conventional activated sludge costs in detail, further analysis is recommended.
Here is a comparison matrix to aid in technology selection:
| Technology | Footprint | COD Removal | CAPEX (50-500 KLD) | OPEX | TNPCB Compliance | Use Case |
|---|---|---|---|---|---|---|
| MBBR | Compact (60% smaller) | 85–95% | ₹30L–₹3Cr | Moderate | High | Space-constrained industrial, medium-scale municipal |
| SBR | Moderate-Large | 80–90% | ₹25L–₹2Cr | Moderate-High (skilled ops) | Moderate-High | Municipal, batch industrial processes |
| MBR | Very Compact | 95%+ | ₹50L–₹5Cr | High (membrane replacement) | Very High | Water reuse, stringent industrial discharge |
TNPCB Compliance Checklist: How to Avoid Closure Notices in Tamil Nadu
Meeting Tamil Nadu Pollution Control Board (TNPCB) effluent standards is non-negotiable for industrial and municipal operations, with non-compliance leading to significant penalties or closure notices. The TNPCB's 2024 norms mandate treated effluent standards of BOD < 10 mg/L, TSS < 20 mg/L, and COD < 250 mg/L for discharge into inland surface waters. Achieving these stringent limits requires a robust multi-stage treatment process covering primary, secondary, and tertiary stages.
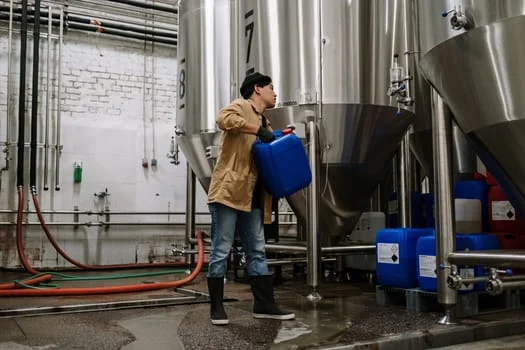
Primary treatment typically involves screening and sedimentation to remove large solids and suspended particles. Secondary treatment focuses on biological processes to reduce organic load (BOD/COD), commonly utilizing MBBR, SBR, or activated sludge systems. Tertiary treatment, which includes disinfection and filtration, is crucial for meeting final discharge standards; options include sand filters, activated carbon filters, and on-site chlorine dioxide generators for TNPCB-compliant disinfection or UV/ozone systems. Common pitfalls include underestimating sludge handling, which can account for up to 15% of total OPEX, and neglecting proper disinfection, leading to microbial non-compliance.
In addition to process requirements, comprehensive documentation is mandatory. This includes obtaining a Consent to Establish (CTE) before construction, a Consent to Operate (CTO) before commissioning, and submitting monthly compliance reports with analytical data of treated effluent. Facilities must also install Continuous Effluent Monitoring Systems (CEMS) for online data submission to TNPCB.
Here is an actionable checklist for TNPCB compliance:
| Requirement | TNPCB Norm (2024) | Action Step | Responsible Party |
|---|---|---|---|
| Effluent Quality Standards | |||
| BOD (Biochemical Oxygen Demand) | < 10 mg/L | Implement secondary biological treatment (e.g., MBBR, SBR) | Engineer/Supplier |
| TSS (Total Suspended Solids) | < 20 mg/L | Install clarifier, filtration (e.g., sand filter, MBR) | Engineer/Supplier |
| COD (Chemical Oxygen Demand) | < 250 mg/L | Optimize aeration, consider advanced oxidation if needed | Engineer/Operator |
| pH | 6.5 – 8.5 | Install pH correction system (acid/alkali dosing) | Operator |
| Process & Infrastructure Requirements | |||
| Primary Treatment | Screening, Sedimentation | Install bar screens, grit chamber, primary clarifier, or DAF systems for pre-treatment of high-TSS industrial wastewater | Engineer/Supplier |
| Secondary Treatment | Biological Process | Design and install activated sludge, MBBR, or SBR system | Engineer/Supplier |
| Tertiary Treatment | Disinfection, Filtration | Install chlorination/UV, sand/activated carbon filters | Engineer/Supplier |
| Sludge Management | Proper Disposal | Install sludge dewatering unit (filter press, centrifuge) | Operator/Waste Contractor |
| Documentation & Reporting | |||
| Consent to Establish (CTE) | Mandatory | Apply to TNPCB before construction | Facility Owner |
| Consent to Operate (CTO) | Mandatory | Apply to TNPCB before commissioning | Facility Owner |
| Compliance Reports | Monthly/Quarterly | Submit analytical reports of treated effluent | Operator/Lab |
| Online Monitoring | CEMS/OCEMS | Install continuous effluent monitoring system with data transmission | Facility Owner/Supplier |
Supplier Evaluation Framework: How to Choose a Wastewater Treatment Partner in Tamil Nadu
Selecting the right wastewater treatment supplier in Tamil Nadu is as crucial as choosing the technology itself, directly impacting project success, long-term operational efficiency, and compliance. A systematic evaluation framework helps procurement managers, plant engineers, and facility owners vet potential partners beyond initial cost estimates.
Firstly, prioritize suppliers with relevant certifications, such as ISO 9001 for quality management and CE marking, which indicates compliance with European health, safety, and environmental protection standards. Avoiding suppliers without CE marking can mitigate risks of equipment failure, safety hazards, and difficulty with international spares. Secondly, robust after-sales support is non-negotiable. Look for suppliers offering a 24/7 helpline, guaranteed spare parts availability with a lead time of less than 48 hours, and comprehensive training programs for your operators. A Coimbatore textile unit, for instance, reported saving ₹20 Lakhs per year in maintenance and downtime costs after switching to an MBBR system from a supplier known for superior after-sales service and operator training.
Thirdly, request case studies and references from similar industries (e.g., textile, pharmaceutical, food & beverage) and of comparable scale. This provides tangible evidence of their experience and success in meeting specific effluent characteristics and regulatory requirements. Be wary of red flags such as vague cost estimates, a lack of transparency regarding long-term OPEX, or a reluctance to conduct thorough site visits to understand your specific challenges. A credible supplier will provide detailed breakdowns of both CAPEX and projected OPEX, ensuring you have a clear financial picture.
Use this scoring matrix to evaluate potential wastewater treatment suppliers:
| Criteria | Weight (%) | Score (1-5) | Evaluation Notes |
|---|---|---|---|
| Certifications & Accreditations (ISO 9001, CE, TNPCB Approval) | 25% | (e.g., 5) | Verify current and relevant certifications. |
| Experience & Case Studies (Similar Projects) | 20% | (e.g., 4) | Request 3+ references from your industry. |
| After-Sales Support & Spare Parts Availability | 20% | (e.g., 4) | Inquire about response times, spare parts inventory, service contracts. |
| Technical Expertise & Innovation | 15% | (e.g., 5) | Assess R&D capabilities, understanding of latest technologies. |
| Cost Transparency (CAPEX, OPEX, Life-Cycle Costs) | 10% | (e.g., 4) | Ensure detailed, itemized cost proposals. |
| Project Management & Delivery Track Record | 10% | (e.g., 4) | Ask about typical project timelines and on-time completion rates. |
| Total Score | 100% | (Calculate) |
Note: Scores are illustrative. Assign values based on your specific project priorities and the supplier's demonstrated capabilities.
ROI Calculator: How to Justify Your Wastewater Treatment Investment
Justifying the significant investment in a wastewater treatment plant requires a clear understanding of its Return on Investment (ROI) and payback period, translating environmental compliance into tangible financial benefits. While initial capital outlay is substantial, the long-term savings from avoided penalties, reduced freshwater consumption through reuse, and enhanced brand reputation can quickly offset these costs. To see how Tamil Nadu’s costs compare to global benchmarks, consider reviewing international project ROI analyses.
The payback period, which indicates the time it takes for the investment to generate enough savings to cover its initial cost, can be calculated using the formula:
Payback Period (Years) = CAPEX / (Annual Savings - Annual OPEX)
For example, if a 200 KLD ETP has a CAPEX of ₹1.85 Crores, generates annual savings of ₹50 Lakhs (from avoided penalties, water reuse, etc.), and incurs ₹30 Lakhs in annual OPEX, the payback period would be: ₹1.85 Crores / (₹50 Lakhs - ₹30 Lakhs) = 9.25 years.
The ROI, expressed as a percentage, measures the profitability of the investment over a period:
ROI (%) = [(Annual Savings - Annual OPEX) / CAPEX] × 100
Using the same example: (₹50 Lakhs - ₹30 Lakhs) / ₹1.85 Crores × 100 = 10.8% ROI. Beyond these direct financial metrics, consider intangible benefits such as improved brand reputation, enhanced regulatory goodwill, and eligibility for government subsidies, like Tamil Nadu’s ₹5 Lakh grant for STPs in residential complexes, which further strengthen the investment case.
Utilize this calculator to estimate your project's financial viability:
| Input/Output | Value (₹) | Description |
|---|---|---|
| Inputs | ||
| CAPEX (Initial Investment) | ₹1,85,00,000 | Total capital expenditure for the ETP/STP |
| Annual Savings (Penalties Avoided, Water Reuse) | ₹50,00,000 | Estimated annual savings from avoided penalties, reduced freshwater purchase, etc. |
| Annual OPEX (Operating Costs) | ₹30,00,000 | Annual power, chemical, labor, maintenance, and sludge disposal costs |
| Outputs | ||
| Annual Net Benefit | ₹20,00,000 | (Annual Savings - Annual OPEX) |
| Payback Period (Years) | 9.25 | CAPEX / Annual Net Benefit |
| ROI (%) | 10.8% | (Annual Net Benefit / CAPEX) × 100 |
Example based on a 200 KLD industrial ETP. Adjust values for your specific project's CAPEX, savings, and operating costs.
Frequently Asked Questions
What is the typical ETP cost in Tamil Nadu for a 100 KLD plant?
For a 100 KLD industrial ETP in Tamil Nadu, the indicative total cost (CAPEX + 1st year OPEX) ranges from ₹1.2 Crores to ₹1.8 Crores, depending on the technology (MBBR, SBR, or MBR), effluent characteristics, and extent of automation. Equipment costs alone typically fall between ₹60 Lakhs to ₹1.2 Crores for this capacity, with civil works and installation adding to the total.
How does TNPCB compliance affect the design and cost of a wastewater treatment plant?
TNPCB compliance significantly influences design and cost by demanding higher treatment efficiency. Meeting strict norms like BOD < 10 mg/L and TSS < 20 mg/L often necessitates advanced secondary and tertiary treatment stages, such as MBR or robust filtration and disinfection. This increases both CAPEX (for specialized equipment) and OPEX (for chemicals, power, and membrane replacement), but ensures avoided penalties and legal operation.
What are the main operational costs (OPEX) for an industrial wastewater treatment plant in Tamil Nadu?
The primary operational costs (OPEX) for an industrial wastewater treatment plant in Tamil Nadu include power consumption (for pumps, blowers, aeration), chemical consumption (for coagulation, flocculation, pH correction, disinfection), labor wages for operators, and maintenance expenses (for spare parts, repairs, and scheduled servicing). Sludge handling and disposal also constitute a significant portion, often up to 15% of the total OPEX.
Can I get government subsidies for installing a sewage treatment plant in Tamil Nadu?
Yes, the Tamil Nadu government offers various incentives and subsidies for environmental protection, including grants for installing sewage treatment plants (STPs) in residential complexes and certain industrial sectors. For instance, grants up to ₹5 Lakhs are available for STPs in residential areas. It is advisable to consult with the Tamil Nadu Pollution Control Board (TNPCB) or relevant municipal bodies for the latest schemes and eligibility criteria.