Wet vs Dry Scrubber Cost Drivers for Industrial Plants
Wet vs dry scrubber cost usually favors dry on CapEx and wet on long-run reagents for high-SO₂ duty. New wet units often run about $500–$1,200/kW versus about $300–$800/kW dry. Dry systems raise lime and solid-waste spend. EPA Control Cost Manual factors (April 2021) put many new builds 20–30% below average retrofit cost.
The choice for SO₂, HCl, and related acid gases turns on CapEx, reagent and waste O&M, water supply, and the emission limit you must hit. Dry systems commonly spend more on lime or bicarbonate ($0.50–$2.00/lb) than wet systems spend on water ($0.10–$0.30/gal). Wet trains need about 0.1–0.3 kWh/m³ for pumps and water treatment. Dry trains need about 0.05–0.15 kWh/m³ but can face $100–$300/ton solid-waste disposal.
Capital Cost Breakdown: New Installations and Retrofits
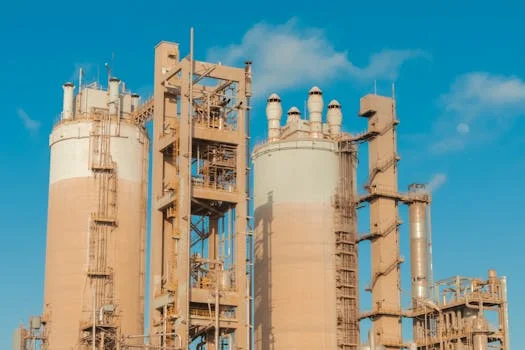
New wet scrubber capital is often estimated at $500–$1,200 per kilowatt (kW). New dry scrubber installs commonly fall near $300–$800/kW in study-level comparisons used with the EPA Air Pollution Control Cost Manual. Wet vessels, piping, and internals often need corrosion-resistant alloys. Scrubbing liquor and captured acids are aggressive. Dry systems look simpler at the absorber. They still need lime silos, pneumatic conveying, and downstream particulate capture.
According to the EPA Control Cost Manual (April 2021), retrofit factors typically run 0.7–1.3 for wet FGD and 0.8–1.5 for dry FGD. RF = 1 marks an average-difficulty site. Earlier planning often applied an approximate 30% retrofit premium to both options. The same manual notes new construction is typically 20–30% less than average retrofits. It recommends RF ≈ 0.77 for new builds. Wet projects also add wastewater tanks, pumps, and treatment, which can add about $200–$500/kW on congested sites. Installation is often 15–25% of wet equipment cost versus about 10–20% for dry equipment cost.
EIA 2018 installed-cost reports in that EPA chapter show wide scatter. Wet FGD systems at ≥90% sulfur removal averaged about $114 million (range $250,000–$709 million). Spray-dryer absorbers (SDA) averaged about $37 million. Circulating dry scrubbers (CDS) averaged about $81 million. Most plants we size for industrial boilers sit far below utility megawatt scales. Use the $/kW bands and plant-specific quotes rather than utility averages alone.
| Plant Size (MW) | Scrubber Type | Estimated Equipment Cost (M$) | Estimated Installation Cost (M$) | Retrofit Premium (M$) | Total Capital Cost Range (M$) |
|---|---|---|---|---|---|
| 100 | Wet Scrubber | $50 – $90 | $7.5 – $22.5 | $15 – $27 | $72.5 – $139.5 |
| 100 | Dry Scrubber | $30 – $60 | $3 – $12 | $9 – $18 | $42 – $90 |
| 500 | Wet Scrubber | $250 – $450 | $37.5 – $112.5 | $75 – $135 | $362.5 – $697.5 |
| 500 | Dry Scrubber | $150 – $300 | $15 – $60 | $45 – $90 | $210 – $450 |
| 1,000 | Wet Scrubber | $500 – $900 | $75 – $225 | $150 – $270 | $725 – $1,395 |
| 1,000 | Dry Scrubber | $300 – $600 | $30 – $120 | $90 – $180 | $420 – $900 |
Operating Costs Compared: Reagents, Energy, Water, and Waste Disposal
Annual O&M often decides the winner after year five. Wet scrubbers lean on water at about $0.10–$0.30 per gallon. They may dose NaOH or similar additives at about $0.50–$1.50 per pound when higher removal is required. Dry scrubbers consume solid sorbents such as lime or sodium bicarbonate at about $0.50–$2.00 per pound. That raises direct reagent cost on high-SO₂ duty.
Energy use also splits. Wet trains typically draw 0.1–0.3 kWh/m³ for pumps, blowers, and water treatment. Dry trains often draw 0.05–0.15 kWh/m³ for fans and pneumatic conveying. Water use for wet scrubbers commonly runs 0.5–2.0 gallons per kWh of plant output under design pollutant load. Dry systems may use only 0.01–0.05 gallons per kWh, mainly for humidification.
Waste is the other budget line. Wet scrubbers can produce about 0.5–1.5 tons of wastewater per ton of SO₂ removed. Treatment is often estimated at $0.50–$2.00 per gallon when neutralization and solids separation are required. Dry scrubbers generate about 0.1–0.3 tons of solid waste per ton of SO₂ removed. Disposal often runs roughly $100–$300 per ton. For wet-effluent treatment cost structure, see Industrial Wastewater Treatment in Alabama USA.
| Cost Category | Scrubber Type | 100 MW Plant Annual O&M Range (M$) | 500 MW Plant Annual O&M Range (M$) | 1,000 MW Plant Annual O&M Range (M$) |
|---|---|---|---|---|
| Reagents | Wet Scrubber | $0.5 – $1.5 | $2.5 – $7.5 | $5.0 – $15.0 |
| Reagents | Dry Scrubber | $1.0 – $3.0 | $5.0 – $15.0 | $10.0 – $30.0 |
| Energy | Wet Scrubber | $0.3 – $0.9 | $1.5 – $4.5 | $3.0 – $9.0 |
| Energy | Dry Scrubber | $0.15 – $0.45 | $0.75 – $2.25 | $1.5 – $4.5 |
| Water | Wet Scrubber | $0.2 – $0.8 | $1.0 – $4.0 | $2.0 – $8.0 |
| Water | Dry Scrubber | $0.01 – $0.05 | $0.05 – $0.25 | $0.1 – $0.5 |
| Waste Disposal | Wet Scrubber (Wastewater) | $0.4 – $1.6 | $2.0 – $8.0 | $4.0 – $16.0 |
| Waste Disposal | Dry Scrubber (Solid) | $0.8 – $2.4 | $4.0 – $12.0 | $8.0 – $24.0 |
| Total Annual O&M (M$) | Wet Scrubber | $1.4 – $4.8 | $7.0 – $24.0 | $14.0 – $48.0 |
| Total Annual O&M (M$) | Dry Scrubber | $1.96 – $5.90 | $9.8 – $29.5 | $19.6 – $59.0 |
What Does a Wet Scrubber System Cost to Own?
A wet scrubber system’s ownership cost is CapEx plus water, energy, additives, and wastewater treatment. That O&M runs across 20–30+ years of equipment life. EPA’s Control Cost Manual (April 2021) notes acid-gas scrubbers are often analyzed at 20–30 years. Many FGD units installed in the 1970s–1980s have already exceeded 30 years. For a high-SO₂ coal or process stream, lower reagent unit cost can offset higher first cost within a decade. That holds only if wastewater treatment stays controlled.
Ownership also includes spare pumps, mist-eliminator cleaning, and corrosion inspection on alloy wetted parts. Plants without sewer capacity or discharge permits should price a closed-loop or zero-liquid-discharge add-on. Do that before calling wet cheaper on O&M. Gypsum recovery on limestone forced-oxidation trains can cut disposal. That works when a wallboard or cement outlet exists nearby.
Compliance Trade-Offs: Which Scrubber Meets Your Emission Limits?
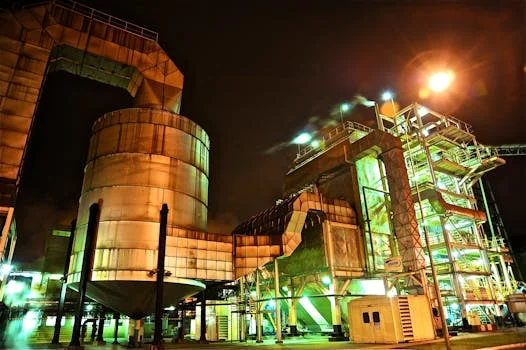
Wet scrubbers typically remove 90–99% of SO₂ and strong acid gases and can capture a share of soluble mercury species. High-dust streams still need upstream particulate control. According to EPA Control Cost Manual data for 2019 coal units (April 2021), wet limestone FGD achieved about 92–99% SO₂ removal. SDA landed about 85–95%, and CDS about 95–98%. New wet FGD designs are cited at up to 99% SO₂ and over 95% HCl. New SDA units are cited up to about 95% SO₂.
Dry scrubbers remain strong on HCl and moderate SO₂ when paired with a baghouse. They rarely meet tight PM limits alone. High-humidity exhaust above about 80% RH or gas above about 300°F often favors wet contactors. Dry lime systems can foul or lose contact efficiency if the gas is not conditioned. A chemical plant case in prior EPA project reporting showed roughly 95% mercury cut with a wet scrubber. The site then spent more than $200,000 per year on wastewater treatment to hold discharge limits. That O&M line belongs in every wet bid.
Non-compliance risk remains material. Earlier facility planning often used Clean Air Act civil-penalty figures near $100,000 per day for severe violations. Confirm the current inflation-adjusted statutory maximum with counsel before you freeze CapEx. NSPS and permit limits for SO₂, NOx, HCl, Hg, and PM still drive technology choice. Brochure efficiency claims matter less.
| Pollutant | Wet Scrubber Removal Efficiency (EPA 2024) | Dry Scrubber Removal Efficiency (Top 3 data) | Typical EPA NSPS Limit (Example) |
|---|---|---|---|
| SO₂ (Sulfur Dioxide) | 90–99% | 80–95% | 0.015 lb/MMBtu |
| NOx (Nitrogen Oxides) | 30–70% (with specific reagents) | Negligible | 0.060 lb/MMBtu |
| HCl (Hydrogen Chloride) | 90–99% | 90–98% | 0.002 lb/MMBtu |
| Hg (Mercury) | 80–95% | Minimal (requires activated carbon injection) | 0.00000002 lb/MMBtu |
| Particulates (PM2.5) | 70–95% (especially fine PM) | Minimal (requires baghouse post-treatment) | 0.015 lb/MMBtu |
When Does a High-Efficiency Wet Scrubber Beat Dry?
A high-efficiency wet scrubber beats dry when you need ≥95% SO₂. It also wins for multi-pollutant capture of acid gases plus soluble metals in wet or hot flue gas. EPA’s April 2021 chapter states new wet FGD can reach 99% SO₂ removal and over 95% HCl. SDA dry/semi-dry systems are typically capped near 95% SO₂ unless a CDS design is used. If your permit also limits Hg²⁺ and you burn higher-chlorine fuel, wet contactors have a clearer path. Dry sorbent alone rarely matches that mercury duty.
Dry wins when water is scarce, wastewater discharge is blocked, and SO₂ loading is moderate. A fabric filter already in the plot plan strengthens that case. Most industrial packages we review for low-to-mid SO₂ duty shortlist dry or semi-dry first. They flip to wet only after the wastewater balance sheet is closed.
ROI Calculator: Payback Periods for Wet vs Dry Scrubbers by Industry
Payback for air pollution control equipment equals capital plus retrofit premium, divided by annual O&M savings plus compliance avoidance value. That framing lets procurement compare wet and dry on the same cash basis. CapEx alone is not enough.
Take a 500 MW coal unit as a worked example. A wet scrubber at about $50 million CapEx with about $1.2 million/year O&M can look worse on day one. A $35 million dry unit at about $2.5 million/year O&M looks cheaper upfront. If reagent and waste deltas hold, the wet option can reach roughly an 8-year payback. That payback is on the incremental capital only. A chemical plant needing acid-gas control only may reverse that result. Compare $10 million dry CapEx at $500,000/year O&M with $15 million wet CapEx at $300,000/year O&M. Dry can win near a 5-year capital recovery when wastewater adders are small.
Avoided penalties and forced outages dominate ROI when limits are binding. Historical planning figures near $100,000 per day for severe Clean Air Act civil exposure still belong in the risk sheet. MATS-related mercury noncompliance costs are often discussed near $50,000 per ton of Hg. Use site-specific counsel for current statutory caps.
Decision Framework: Which Scrubber Fits Your Industrial Application?
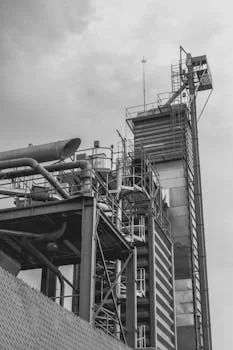
Selecting scrubber technology starts with pollutant profile, water and waste constraints, and plot space. Do not stop at a single wet vs dry scrubber cost headline. Coal or high-sulfur fuel boilers with high SO₂ and large gas volumes still lean wet. Removal margin is the reason. Lower-SO₂ or water-limited retrofits lean dry or semi-dry. That is especially true where a baghouse already exists.
Chemical plants with heavy metals and mixed acid gases often need wet contactors. HCl/HF-only vents with no discharge path often stay dry. Waste incinerators commonly combine acid-gas scrubbing with particulate polishing. Pulp and paper TRS odor control favors wet scrubbing. Bark-boiler particulates may use dry capture. For wet-scrubber sludge handling after clarification, compare screw press dewatering vs alternatives. Integrated utility-style packages such as a Flue Gas Desulfurization (FGD) Scrubber System are sized from gas rate, inlet SO₂, and byproduct route. Nameplate MW alone is not enough.
| Industrial Application | Primary Pollutants | Preferred Scrubber Type | Key Considerations (Capital vs. O&M) |
|---|---|---|---|
| Coal/Gas Power Plants | SO₂, NOx, Hg | Wet Scrubber (high SO₂), Dry Scrubber (low SO₂) | Wet: Higher capital, lower O&M (reagents). Dry: Lower capital, higher O&M (reagents, waste). |
| Chemical Plants | HCl, HF, Heavy Metals (Hg, Pb) | Wet Scrubber (heavy metals), Dry Scrubber (acid gases) | Wet: Comprehensive removal, wastewater treatment cost. Dry: Simpler, no wastewater, higher reagent/solid waste. |
| Waste Incinerators | Dioxins/Furans, HCl, SO₂ | Wet Scrubber (multi-pollutant), Dry Scrubber (acid gases) | Wet: High efficiency, complex waste. Dry: Simpler, requires baghouse for PM. |
| Pulp & Paper Mills | TRS, Particulates, SO₂ | Wet Scrubber (TRS odor), Dry Scrubber (particulates) | Wet: Odor control, water usage. Dry: PM control, lower water. |
Selection checklist
- Confirm permit limits for SO₂, HCl, Hg, and PM at actual O₂ and load.
- Measure inlet gas moisture, temperature, and dust before picking wet or dry.
- Price wastewater treatment or ZLD for wet; landfill and reagent logistics for dry.
- Apply a documented retrofit factor (wet RF ~0.7–1.3; dry RF ~0.8–1.5 per EPA 2021).
- Require vendor guarantees at design L/G or stoichiometric ratio, not brochure peaks.
- Include 15-year reagent, energy, water, and disposal cash flows in the bid tab.
- Plan particulate polishing early if you choose dry acid-gas control.
Who This Is For and Next Step
This comparison fits plant engineers, EPC process leads, and procurement teams. It targets acid-gas controls for boilers, incinerators, and chemical vents. Look elsewhere if you only need a small laboratory hood scrubber. The same applies to a VOC oxidizer with no acid-gas duty. If you need a site-specific CapEx/O&M tab from gas data and permit limits, request a scrubber cost review. Attach your flue-gas analysis.
Frequently Asked Questions
Are wet or dry scrubbers better for high-humidity exhaust streams?
Wet scrubbers are better for high-humidity (>80% RH) or high-temperature (>300°F) exhaust. Liquid contact keeps mass transfer stable. Dry scrubbers can foul or lose efficiency when moisture is not controlled. They often need gas conditioning first. Field designs that keep wet contactors on saturated gas commonly hold 90%+ acid-gas removal. Poorly conditioned dry systems can fall toward roughly 60–70% on the same stream.
What is the main disadvantage of wet scrubbers?
The main disadvantage of wet scrubbers is wastewater treatment. They can produce about 0.5–1.5 tons of wastewater per ton of SO₂ removed. Treatment often adds about $0.50–$2.00/gal when neutralization and solids removal are required. Dry scrubbers avoid that liquid stream but typically pay more for lime or bicarbonate at about $0.50–$2.00/lb. Water for wet duty is about $0.10–$0.30/gal.
Do dry scrubbers require more maintenance than wet scrubbers?
Dry scrubbers generally need less routine mechanical maintenance. They have fewer pumps and liquid distributors. They still need frequent reagent logistics and pneumatic-line upkeep every 1–3 months of heavy service. Wet scrubbers need regular corrosion, scaling, and pump checks. Many O&M reviews put wet annual maintenance about 10–15% higher than comparable dry trains.
What do scrubbers remove 90% of?
Scrubbers remove 90%+ of many acid gases (SO₂, HCl, HF) when designed for those species. They also cut a large share of soluble heavy metals from industrial exhaust. Wet scrubbers can also cut fine PM and odor compounds such as TRS. Dry scrubbers often reach about 80–95% SO₂/HCl and then rely on baghouses for particulates. EPA’s 2021 FGD performance tables place many wet limestone units at 92–99% SO₂ removal. SDA units land at about 85–95%.
How do wet scrubber costs compare to dry scrubbers in California?
In California, wet scrubbers often cost 25–50% more installed than dry options. Wastewater limits and water scarcity drive that gap. A 2023 Bay Area refinery retrofit comparison in the source material showed about $75M wet with wastewater treatment versus about $50M dry. The dry case still needed roughly $10M of baghouse adders to hold PM. Annual O&M in that comparison ran about $1.8M wet versus $2.2M dry. Both cases targeted 0.015 lb/MMBtu SO₂.
Related Equipment
- HydropureWater’s integrated FGD scrubber systems with gypsum byproduct recovery — view specifications, capacity range, and technical data
Need a customized solution? Request a free quote with your specific flow rate and pollutant parameters.