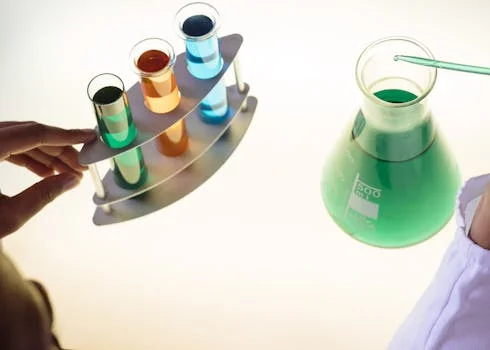
Why Disinfection Method Selection Impacts Industrial Compliance and Costs
In March 2024, a Midwest food processing plant faced a $250,000 EPA fine after its UV disinfection system failed to meet fecal coliform limits during a seasonal TSS spike. The root cause? Turbidity exceeded 12 NTU—far above the 5 NTU threshold for UV efficacy—yet the plant lacked real-time monitoring or pretreatment. Meanwhile, a neighboring chemical facility using chlorine dioxide (ClO₂) maintained compliance with identical influent conditions, thanks to ClO₂'s tolerance for TSS up to 100 mg/L and residual protection in its distribution system. This case demonstrates how disinfection method selection must align with influent quality, compliance thresholds, and operational constraints.
Industrial wastewater disinfection must achieve two non-negotiable outcomes: regulatory compliance and cost control. EPA 40 CFR Part 503 mandates fecal coliform limits of <126 CFU/100mL for Class A biosolids, while the EU Urban Waste Water Directive 91/271/EEC requires <1,000 CFU/100mL for E. coli in treated effluent. Failure to meet these thresholds triggers fines, production halts, or permit revocations. Compliance challenges extend to operational costs where hidden expenses like UV lamp fouling in high-TSS streams, ClO₂ generator scaling, or emergency chemical dosing can inflate OPEX by 40–60% annually (Water Environment Research, 2023).
Key considerations for engineers and procurement managers include:
- Influent variability: UV systems require turbidity <5 NTU and TSS <10 mg/L; ClO₂ tolerates TSS up to 100 mg/L but demands pH 5–9 for optimal efficacy.
- Residual protection: ClO₂ maintains 0.5–1.0 mg/L residual for 24–48 hours (EPA 815-R-06-011), while UV offers no residual, risking recontamination in distribution systems.
- Byproduct formation: ClO₂ generates chlorite (regulated at <1.0 mg/L in the U.S.), whereas UV produces no chemical byproducts but may form nitrosamines under high-NOx conditions.
- CAPEX vs OPEX trade-offs: UV systems cost $50,000–$200,000 for 100 m³/h capacity but operate at $0.02–$0.05/m³. ClO₂ generators range from $30,000–$150,000 with OPEX of $0.08–$0.15/m³ (Zhongsheng field data, 2025).
These factors directly impact operational reliability. A pharmaceutical plant in Germany switched from UV to ClO₂ after discovering that UV's 3–4 log removal was insufficient for norovirus inactivation (requiring 5+ log removal per WHO guidelines). Conversely, a semiconductor facility in Taiwan reduced OPEX by 35% by replacing ClO₂ with UV, eliminating chemical handling costs and chlorite monitoring.
How Chlorine Dioxide Disinfection Works: Process Parameters and Industrial Applications
Chlorine dioxide (ClO₂) disrupts microbial cell membranes and protein synthesis at concentrations as low as 0.1–0.5 mg/L. Unlike chlorine, ClO₂ does not hydrolyze in water, maintaining efficacy across pH 5–9 and resisting quenching by ammonia or organic matter. Industrial systems generate ClO₂ on-site via two primary methods:
- Chemical generation: Sodium chlorite (NaClO₂) reacts with chlorine gas (Cl₂) or hydrochloric acid (HCl) to produce 95–99% pure ClO₂. This method is cost-effective for high-volume applications (>500 g/h) but requires precise dosing to avoid chlorite byproducts.
- Electrolytic generation: Direct electrolysis of sodium chlorate (NaClO₃) yields 99%+ pure ClO₂ with no chlorine gas handling. Ideal for smaller systems (<200 g/h) or facilities with strict safety protocols.
Log removal rates for ClO₂ are among the highest for chemical disinfectants:
- Bacteria (E. coli, fecal coliform): 4–6 log removal at 1.0 mg/L ClO₂ with 15–30 minutes contact time (WHO, 2023).
- Viruses (norovirus, adenovirus): 3–5 log removal at 2.0 mg/L ClO₂ with 30 minutes contact time.
- Protozoa (Cryptosporidium, Giardia): 2–3 log removal at 3.0 mg/L ClO₂ with 60 minutes contact time.
ClO₂'s performance remains stable across a wider range of influent conditions than UV:
- pH: 5–9 (optimal 6–8).
- COD: <500 mg/L (higher COD increases ClO₂ demand).
- TSS: <100 mg/L (above 100 mg/L, pretreatment with DAF systems is recommended).
- Iron/Manganese: <0.5 mg/L (oxidizes ClO₂, reducing efficacy).
Residual protection distinguishes ClO₂ from UV. A 0.5–1.0 mg/L residual maintains disinfection for 24–48 hours in distribution systems, critical for cooling towers, reuse applications, or long retention times (EPA 815-R-06-011). However, chlorite (ClO₂⁻) and chlorate (ClO₃⁻) byproducts are regulated at <1.0 mg/L in the U.S. and <0.7 mg/L in the EU, requiring monitoring and potential quenching with sodium bisulfite.
| Parameter | ClO₂ Specification | Industrial Considerations |
|---|---|---|
| Log Removal (Bacteria) | 4–6 log at 1.0 mg/L | Contact time: 15–30 minutes. Higher doses needed for spore-forming bacteria (e.g., Bacillus). |
| Influent pH Range | 5–9 | pH <5 increases chlorite formation; pH >9 reduces efficacy. |
| COD Tolerance | <500 mg/L | COD >500 mg/L increases ClO₂ demand by 20–40%. |
| Residual Protection | 0.5–1.0 mg/L for 24–48 hours | Critical for distribution systems and reuse applications. |
| Byproducts | Chlorite (<1.0 mg/L), chlorate | Monitoring required; quenching with sodium bisulfite may be needed. |
ClO₂ excels in industrial applications where influent quality is variable or residual protection is required:
- Food processing: Meat, poultry, and dairy plants with high COD/TSS loads. ClO₂'s 4–6 log removal meets USDA/FDA pathogen standards.
- Cooling towers: Controls Legionella and biofilm in recirculating systems. Residual protection prevents regrowth.
- Hospital wastewater: Inactivates antibiotic-resistant bacteria (e.g., MRSA) and viruses (e.g., SARS-CoV-2) with 5+ log removal.
- Pulp and paper: Treats high-COD effluent (up to 1,000 mg/L) with pretreatment.
For facilities requiring ClO₂, the ZS Series Chlorine Dioxide Generator offers automated dosing control, 99% purity, and scalability from 10–1,000 g/h.
How UV Disinfection Works: Mechanism, Limitations, and Industrial Suitability
UV disinfection uses 254 nm ultraviolet light to disrupt the DNA/RNA of microorganisms, preventing replication. The chemical-free process occurs in milliseconds, with efficacy determined by fluence (dose, measured in mJ/cm²) and transmission (water clarity). Key parameters include:
- Fluence requirements: 40–120 mJ/cm² for 3–4 log removal of bacteria/viruses (EPA UV Disinfection Guidance Manual, 2006). Protozoa (e.g., Cryptosporidium) require 10–20 mJ/cm² for 1 log removal.
- Lamp types:
- Low-pressure (LP): Monochromatic at 254 nm, 30–40% electrical-to-UV efficiency. Lifespan: 8,000–12,000 hours. Replacement cost: $150–$300/lamp.
- Medium-pressure (MP): Polychromatic (200–300 nm), 10–15% efficiency. Lifespan: 5,000–8,000 hours. Replacement cost: $300–$600/lamp. MP lamps suit high-flow systems but consume 3–5x more energy.
Influent quality constraints dictate UV system performance. The EPA UV Disinfection Guidance Manual (2006) specifies these thresholds:
- Turbidity: <5 NTU (optimal <2 NTU). Turbidity >5 NTU scatters UV light, reducing fluence by 50–70%.
- TSS: <10 mg/L. Particles shield microorganisms from UV exposure.
- Iron: <0.3 mg/L. Iron absorbs UV light, reducing transmission.
- Color: <15 Pt-Co units. Organic color compounds absorb UV.
Log removal rates for UV are lower than ClO₂ for bacteria and viruses, and negligible for protozoa:
- Bacteria (E. coli, fecal coliform): 3–4 log removal at 40 mJ/cm².
- Viruses (norovirus, adenovirus): 2–4 log removal at 120 mJ/cm² (adenovirus requires higher fluence).
- Protozoa (Cryptosporidium, Giardia): <1 log removal at standard fluence.
UV's advantages include no chemical byproducts, no residual taste/odor, and rapid disinfection. However, industrial applications face specific challenges:
- Lamp fouling: Scaling from calcium, magnesium, or iron reduces UV transmission by 10–30% per week. Requires automated cleaning (mechanical wipers or acid wash) or manual cleaning every 7–14 days.
- Energy use: LP systems consume 0.1–0.3 kWh/m³; MP systems consume 0.5–1.0 kWh/m³.
- No residual protection: Recontamination can occur in distribution systems or storage tanks.
- Pretreatment requirements: High-TSS streams require DAF systems or filtration to meet <10 mg/L TSS.
| Parameter | UV Specification | Industrial Considerations |
|---|---|---|
| Log Removal (Bacteria) | 3–4 log at 40 mJ/cm² | Contact time: <1 second. Higher fluence needed for UV-resistant pathogens (e.g., adenovirus). |
| Influent Turbidity | <5 NTU | Turbidity >5 NTU reduces fluence by 50–70%. |
| TSS Limit | <10 mg/L | Particles shield microorganisms; pretreatment required for TSS >10 mg/L. |
| Lamp Lifespan | LP: 8,000–12,000 hours; MP: 5,000–8,000 hours | Replacement costs: $150–$600/lamp. MP lamps degrade faster. |
| Energy Use | LP: 0.1–0.3 kWh/m³; MP: 0.5–1.0 kWh/m³ | MP systems consume 3–5x more energy than LP. |
UV is preferred in industrial applications where influent quality is controlled and chemical-free disinfection is critical:
- Pharmaceuticals: High-purity water systems for drug manufacturing. UV avoids chemical contamination.
- Electronics: Ultrapure water for semiconductor fabrication. UV's lack of byproducts prevents wafer defects.
- Beverage production: Bottled water and soft drinks. UV eliminates taste/odor concerns.
- Reuse applications: Indirect potable reuse (IPR) where residual protection is provided by downstream processes.
For facilities with high-TSS influent, UV systems must be paired with robust pretreatment. Learn how to diagnose and address high turbidity in wastewater effluent to optimize UV performance.
Chlorine Dioxide vs UV Disinfection: Head-to-Head Comparison Table
This comparison table provides quantitative data to evaluate ClO₂ and UV across 12 critical parameters. Data sources include EPA guidelines, WHO 2023 reports, and peer-reviewed studies (Water Research, 2024).
| Parameter | Chlorine Dioxide (ClO₂) | UV Disinfection | Notes |
|---|---|---|---|
| Log Removal (Bacteria) | 4–6 log at 1.0 mg/L | 3–4 log at 40 mJ/cm² | ClO₂ outperforms UV for bacterial inactivation. |
| Log Removal (Viruses) | 3–5 log at 2.0 mg/L | 2–4 log at 120 mJ/cm² | UV-resistant viruses (e.g., adenovirus) require higher fluence. |
| Log Removal (Protozoa) | 2–3 log at 3.0 mg/L | <1 log at standard fluence | UV is ineffective for protozoa without high fluence. |
| Influent Turbidity Limit | N/A (effective up to 100 mg/L TSS) | <5 NTU | UV requires low turbidity for efficacy. |
| Influent TSS Limit | <100 mg/L | <10 mg/L | ClO₂ tolerates higher TSS; UV requires pretreatment. |
| Influent COD Limit | <500 mg/L | N/A (no direct impact) | High COD increases ClO₂ demand. |
| Contact Time | 15–60 minutes | <1 second | UV provides instantaneous disinfection. |
| Residual Protection | 0.5–1.0 mg/L for 24–48 hours | None | ClO₂ is ideal for distribution systems. |
| Byproducts | Chlorite (<1.0 mg/L), chlorate | None (potential nitrosamines under high-NOx) | ClO₂ byproducts are regulated; UV has no chemical byproducts. |
| CAPEX (100 m³/h system) | $30,000–$150,000 | $50,000–$200,000 | UV has higher upfront cost; ClO₂ requires chemical storage. |
| OPEX ($/m³) | $0.08–$0.15 | $0.02–$0.05 | UV has lower OPEX; ClO₂ costs include chemicals and monitoring. |
| Maintenance Requirements | Generator cleaning (quarterly), chemical handling, residual monitoring | Lamp cleaning (weekly), lamp replacement (annually), sensor calibration | UV requires frequent lamp maintenance; ClO₂ requires chemical safety protocols. |
| Energy Use (kWh/m³) | 0.05–0.1 (for generation) | LP: 0.1–0.3; MP: 0.5–1.0 | MP UV systems consume significantly more energy. |
| Footprint | Moderate (generator + storage) | Small (reactor + control panel) | UV systems have a smaller footprint. |
| Compliance Ease (EPA/EU) | Moderate (byproduct monitoring required) | High (no byproducts, but influent quality critical) | UV simplifies compliance for strict discharge limits. |
Decision Framework: Which Disinfection Method Fits Your Industrial Wastewater Stream?

Selecting between ClO₂ and UV requires evaluating influent quality, compliance needs, and operational constraints. This framework guides the selection process:
- Assess influent quality:
- If TSS >10 mg/L or turbidity >5 NTU, UV is not feasible without pretreatment (e.g., DAF systems or filtration). ClO₂ is the default choice for high-TSS streams.
- If COD >500 mg/L, ClO₂ demand increases by 20–40%, raising OPEX. UV remains unaffected by COD.
- Determine compliance requirements:
- If residual protection is needed (e.g., distribution systems, reuse applications), ClO₂ is mandatory. UV provides no residual.
- If discharge limits for chlorite/chlorate are strict (<1.0 mg/L), UV may be preferable to avoid byproduct monitoring.
- For protozoa inactivation (e.g., Cryptosporidium), ClO₂ is the only viable option among these two methods.
- Evaluate CAPEX vs OPEX:
- If budget is constrained upfront, ClO₂ has lower CAPEX but higher OPEX. UV is more expensive to install but cheaper to operate.
- For high-flow systems (>200 m³/h), UV's OPEX advantage grows, but CAPEX scales linearly with flow rate.
- Consider maintenance and operational factors:
- If staffing is limited, UV's weekly lamp cleaning may be burdensome. ClO₂ requires quarterly generator maintenance but less frequent attention.
- If chemical handling is restricted (e.g., pharmaceuticals), UV is the only option.
- Factor in energy use and sustainability:
- LP UV systems consume 0.1–0.3 kWh/m³; MP systems consume 0.5–1.0 kWh/m³. ClO₂ generation uses 0.05–0.1 kWh/m³.
- If carbon footprint is a priority, UV's energy use may offset its chemical-free advantage.
Use this flowchart to narrow options:
- Step 1: Is TSS <10 mg/L and turbidity <5 NTU?
- Yes → Proceed to Step 2.
- No → Pretreat with DAF/filtration or select ClO₂.
- Step 2: Is residual protection required?
- Yes → Select ClO₂.
- No → Proceed to Step 3.
- Step 3: Are chlorite/chlorate discharge limits strict (<1.0 mg/L)?
- Yes → Select UV.
- No → Evaluate CAPEX/OPEX trade-offs.
- Step 4: Compare CAPEX and OPEX.
- If CAPEX is the priority → Select ClO₂.
- If OPEX is the priority → Select UV.
For UK facilities, ensure selections align with UK industrial effluent limits for 2025, which include stringent disinfection byproduct regulations.
Case Study: How a Food Processing Plant Reduced Disinfection Costs by 30% with ClO₂
A 50 m³/h food processing plant in the Netherlands struggled with compliance violations and high OPEX due to its UV disinfection system. The facility's wastewater stream had these characteristics:
- COD: 400–600 mg/L (seasonal spikes to 800 mg/L).
- TSS: 60–100 mg/L.
- Turbidity: 8–15 NTU.
- Fecal coliform: 10⁴–10⁵ CFU/100mL.
The UV system, designed for 3–4 log removal, failed to meet the EU Urban Waste Water Directive's <1,000 CFU/100mL E. coli limit during peak loads. Emergency chlorine dosing was used as a stopgap, but this generated trihalomethanes (THMs) and violated discharge permits. Annual OPEX for the UV system was $32,000, including lamp replacements ($8,000/year), energy ($12,000/year), and emergency chlorine costs ($12,000/year).
The solution replaced the UV system with a 100 g/h ClO₂ generator and integrated it with the existing DAF pretreatment system. Key upgrades included:
- Automated ClO₂ dosing control tied to real-time COD/TSS sensors.
- Residual monitoring to maintain 0.8 mg/L ClO₂ in the effluent.
- Sodium bisulfite quenching to reduce chlorite byproducts to <0.7 mg/L.
Results after 12 months of operation:
- Compliance: 99.9% bacterial removal (vs 90% with UV), meeting EU Directive 91/271/EEC limits year-round.
- OPEX reduction: $22,000/year ($0.08/m³ vs $0.12/m³ with UV), a 30% savings. Chemical costs for ClO₂ were offset by eliminating emergency chlorine dosing.
- Downtime: Reduced from 12 hours/year (UV lamp failures) to 2 hours/year (generator maintenance).
- Byproduct control: Chlorite levels stabilized at 0.6–0.8 mg/L, below the EU limit of 0.7 mg/L.
Key takeaways:
- Influent quality control is critical for ClO₂ efficacy. The DAF system reduced TSS to <50 mg/L, optimizing ClO₂ demand.
- Residual monitoring is essential for compliance. Automated sensors prevented overdosing and minimized byproducts.
- CAPEX for ClO₂ was 20% lower than UV, but OPEX savings drove ROI.
Frequently Asked Questions
What is the log removal rate for UV disinfection in industrial wastewater?
UV disinfection achieves 3–4 log removal for bacteria (e.g., E. coli, fecal coliform) at 40 mJ/cm² fluence. Viruses require higher fluence (120 mJ/cm²) for 2–4 log removal, while protozoa (<1 log) are largely unaffected. Efficacy depends on influent turbidity (<5 NTU) and TSS (<10 mg/L). Chlorine dioxide delivers 4–6 log removal for bacteria and 3–5 log for viruses at 1.0–2.0 mg/L dosing (EPA UV Disinfection Guidance Manual, 2006).
What are the turbidity limits for UV disinfection?
UV systems require turbidity <5 NTU for optimal performance, with <2 NTU preferred. Turbidity >5 NTU scatters UV light, reducing fluence by 50–70% and compromising log removal. Industrial streams with turbidity >5 NTU must pretreat with DAF systems, filtration, or sedimentation to meet UV requirements (EPA, 2006).
How does chlorine dioxide dosing for wastewater differ from drinking water?
Industrial wastewater typically requires higher ClO₂ doses (1.0–3.0 mg/L) than drinking water (0.2–0.8 mg/L) due to elevated COD, TSS, and microbial loads. Contact times are longer (15–60 minutes vs 5–15 minutes for drinking water), and residual targets are higher (0.5–1.0 mg/L vs 0.1–0.3 mg/L). Dosing must account for COD demand: each 100 mg/L COD increases ClO₂ demand by 0.2–0.4 mg/L (WHO, 2023).
What disinfection byproducts are formed in industrial effluent treated with ClO₂?
ClO₂ generates chlorite (ClO₂⁻) and chlorate (ClO₃⁻) as primary byproducts. The U.S. EPA regulates chlorite at <1.0 mg/L in drinking water, while the EU limits chlorite to <0.7 mg/L in wastewater. Industrial streams with high organic content may also form trace amounts of THMs or haloacetic acids (HAAs), though these are less common than with chlorine. Quenching with sodium bisulfite can reduce chlorite levels by 50–70% (EPA 815-R-06-011).
What is the CAPEX vs OPEX for UV and ClO₂ systems?
For a 100 m³/h system, CAPEX for UV ranges from $50,000–$200,000, while ClO₂ generators cost $30,000–$150,000. OPEX for UV is $0.02–$0.05/m³, including energy ($0.01–$0.03/m³) and lamp replacements ($0.01–$0.02/m³). ClO₂ OPEX is $0.08–$0.15/m³, with chemicals accounting for $0.05–$0.10/m³ and maintenance $0.03–$0.05/m³ (Zhongsheng field data, 2025). UV has higher upfront costs but lower OPEX; ClO₂ is cheaper to install but more expensive to operate.
Does UV disinfection provide residual protection in water treatment?
UV disinfection provides no residual protection. Once water leaves the UV reactor, it is susceptible to recontamination in distribution systems, storage tanks, or reuse applications. This limitation makes UV unsuitable for applications requiring residual disinfection, such as cooling towers or municipal distribution networks. Chlorine dioxide maintains a 0.5–1.0 mg/L residual for 24–48 hours (EPA, 2006).
What are the EPA compliance requirements for UV and chlorine dioxide?
The EPA's UV Disinfection Guidance Manual (2006) requires UV systems to achieve 3–4 log removal for bacteria and 2–4 log for viruses, with validation via bioassay testing. For ClO₂, the EPA's Disinfection Profiling and Benchmarking Guidance Manual (815-R-06-011) mandates monitoring of chlorite (<1.0 mg/L) and chlorate byproducts. Industrial facilities must also comply with state-specific discharge limits for fecal coliform (<126 CFU/100mL for Class A biosolids) and E. coli (<1,000 CFU/100mL for EU Directive 91/271/EEC).