Semiconductor UPW system SEMI F63 specifications set the 2026 purity bar: resistivity at or above 18.2 MΩ·cm, TOC below 1.0 ppb, and particles above 0.05 μm at or under 100/mL for critical wafer rinse steps.
The stakes justify the margins. At a 7nm node fab, a subtle resistivity fluctuation caused three days of unplanned downtime at an estimated $3 million per day in lost output. A biofilm outbreak in a polishing loop produced a 12% yield loss across multiple wafer lots. Power outages have also driven silica leaching from RO membranes that then hit wafer quality.
Reliable UPW supply rests on four pillars: strategic redundancy, real-time monitoring, preventive maintenance, and a staged treatment train. The sections below translate those pillars into purity tables, process architecture, cost models, and selection checks used in 2026 fab projects.
Semiconductor UPW System Specifications: SEMI Standards and F63 Purity Tables
Semiconductor UPW system specifications for 2026 hold resistivity at ≥18.2 MΩ·cm, TOC below 1 ppb, particles above 0.05 μm under 100/mL, dissolved oxygen under 10 ppb, silica under 10 ppb, and boron under 1 ppb. ITRS 2026 projections tighten TOC, particles, oxygen, silica and boron by half, and bacteria to 0.1 CFU/mL, versus SEMI F63-0921 baselines.
Plant teams often begin with semi f63 purity tables, then add node-specific margins for TOC, particles, dissolved oxygen, silica, boron, and bacteria. SEMI F63-0921 (2021) still sets common published baselines, while ITRS 2026 projections tighten several limits for advanced lithography and etch. Reference physics frames how close to the ceiling those numbers sit. According to Wikipedia's ultrapure water overview, pure water has a conductivity of 0.05501 μS/cm and a resistivity of 18.18 MΩ·cm at 25 °C, so ≥18.2 MΩ·cm is effectively the theoretical maximum held continuously.
For wafer cleaning and rinsing, resistivity must stay at or above 18.2 MΩ·cm, TOC below 1 ppb, and particles greater than 0.05 μm at or under 100/mL. Some advanced fabs also run hot UPW at 80–90°C to raise solubility and reaction kinetics, which needs dedicated heating and distribution hardware. Internal 3nm specifications are often 20% stricter than published SEMI standards because trace residues can become killer defects in dense chip layouts.
| Parameter | SEMI F63-0921 (2021) | ITRS 2026 (Projected) | Rationale for Tightening Specs |
|---|---|---|---|
| Resistivity (MΩ·cm) | ≥ 18.2 | ≥ 18.2 | Essential for preventing ionic contamination in critical layers. |
| TOC (ppb) | < 1.0 | < 0.5 | Prevents organic residues that can cause defects, especially in EUV lithography. |
| Particles (>0.05 μm/mL) | < 100 | < 50 | Minimizes particulate contamination that can cause short circuits or scattering. |
| Dissolved Oxygen (ppb) | < 10 | < 5 | Reduces oxidation and corrosion of sensitive materials. |
| Silica (SiO₂, ppb) | < 10 | < 5 | Prevents silica deposition and pattern collapse. |
| Boron (ppb) | < 1 | < 0.5 | Crucial for controlling doping profiles in advanced transistors. |
| Bacteria (CFU/mL) | < 1 | < 0.1 | Eliminates biofouling and microbial contamination. |
UPW Treatment Train Design for a 300mm Fab: Stages and Efficiency Benchmarks
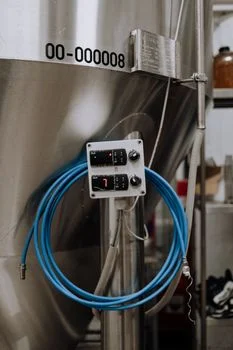
A semiconductor UPW train removes contaminants stage by stage down to parts-per-trillion levels. Raw-water pretreatment with coagulation and multimedia filtration protects downstream membranes. Primary RO typically recovers 90–95% of water, removes about 99% of dissolved ions, and cuts only 50–70% of TOC.
Secondary RO often recovers 95–98% and further lowers residual ions and organics. EDI or mixed-bed polishing then pushes resistivity to final targets; according to Wikipedia's electrodeionization overview, the technology produces water 'reaching electrical resistivity values as high as 18.2 MΩ/cm'. UV oxidation at 185/254 nm commonly removes 90–95% of TOC at about 1,000 mJ/cm². UF near 0.1 μm pore size forms the last particle barrier before the polishing loop.
Membrane contactors strip CO₂ and O₂ so resistivity targets remain reachable at point of use. Leading-edge fabs usually specify N+1 redundancy on RO trains and polishing loops with automatic failover. Reference designs also place final filters with pore sizes ≤200 nm immediately before distribution, per the same ultrapure water reference. Related semiconductor high-purity water treatment process design notes help size pretreatment and recycle interfaces around this train.
| Stage | Primary Function | Typical Efficiency | Key Contaminants Removed | Notes |
|---|---|---|---|---|
| 1. Raw Water Pretreatment | Initial purification of feed water. | >90% suspended solids removal. | Turbidity, suspended solids, some dissolved organics. | Coagulation, Multimedia Filtration, Activated Carbon. |
| 2. Primary RO | Bulk removal of dissolved ions and organics. | 90–95% recovery; 99% ion removal; 50–70% TOC removal. | Dissolved salts, multivalent ions, large organic molecules. | High-recovery systems reduce water costs. Link: /product/6-reverse-osmosis-ro-water-purification.html |
| 3. Secondary RO | Further reduction of ionic and organic impurities. | 95–98% recovery; >99.5% ion removal. | Residual ions, smaller organic molecules. | Often a two-stage or high-rejection configuration. |
| 4. Polishing (EDI or Mixed-Bed) | Achieve final resistivity targets. | >99.99% ion removal. | Monovalent ions, trace dissolved salts. | EDI offers lower chemical usage; Mixed-bed offers high purity. |
| 5. UV Oxidation (185/254 nm) | Break down organic molecules into CO₂ and H₂O. | 90–95% TOC reduction at 1,000 mJ/cm². | Dissolved organic compounds (TOC). | Essential for meeting sub-ppb TOC requirements. |
| 6. Ultrafiltration (UF) | Remove sub-micron particles and bacteria. | >99.99% removal of particles >0.1 μm. | Colloids, bacteria, pyrogens. | Final physical barrier before distribution. |
| 7. Polishing Loop & Monitoring | Maintain and verify UPW quality at point-of-use. | Real-time resistivity, TOC, particle monitoring. | Ensures delivered water meets specifications. | Includes recirculation and point-of-use filters. |
RO vs EDI vs Mixed-Bed Polishing: Cost, Efficiency, and Use-Case Matching
Mixed-bed polishing can reach ≥18.2 MΩ·cm but raises OpEx through resin regeneration and chemical use. EDI usually needs higher CapEx, yet continuous chemical-free operation can cut OpEx by up to 22% versus mixed-bed on large plants. Fabs under 1,000 m³/day often keep mixed-bed for lower initial spend.
For 300mm fabs needing over 3,000 m³/day of UPW, EDI is the common baseline. Continuous electrodeionization (CEDI) is projected to cut energy use by 15% versus conventional EDI by 2026. Hybrid trains that pair EDI with a small mixed-bed polisher balance peak purity and longer run cycles. Feed limits discipline the layout: per Wikipedia's EDI overview, feed hardness is 'often limited to 1 part per million (ppm) of CaCO3', and silica 'generally must be no more than 1 ppm in most EDI cells or 2 ppm in thin-cell modules'. Softening and secondary RO therefore sit upstream of every EDI skid we commission.
| Technology | CapEx ($/m³/day) | OpEx ($/m³) | Resistivity Output (MΩ·cm) | TOC Removal | Silica Removal | Footprint | Maintenance |
|---|---|---|---|---|---|---|---|
| Mixed-Bed Polishing (Ion Exchange Resin) | Low to Medium | Medium to High (Resin replacement/regeneration) | ≥ 18.2 | Good (indirectly via ion removal) | Excellent | Compact | Frequent regeneration/replacement cycles. |
| EDI (Electrodeionization) | Medium to High | Low to Medium (Energy, minor membrane cleaning) | ≥ 18.2 | Good (indirectly via ion removal) | Excellent | Medium | Periodic membrane cleaning, occasional module replacement. Link: /product/5-jy-integrated-water-purification.html |
| Hybrid (EDI + Mixed-Bed) | Medium | Low | ≥ 18.2 | Excellent | Excellent | Medium | Optimized maintenance based on EDI performance. |
Semiconductor UPW System CapEx and OpEx: 2026 Cost Models for Fab Budgets
For a typical 3,000 m³/day UPW system, CapEx in 2026 ranges from $1.2 million to $4 million per 1,000 m³/day of capacity. That envelope covers RO, EDI, UV, UF, installation, PLC automation, and N+1 redundancy. OpEx usually falls between $0.80 and $1.50 per cubic meter, with energy near 40% of operating cost.
High-recovery RO can raise energy use by up to 25% even while cutting raw-water demand. Chemical regeneration, media replacement, and labor fill the rest of OpEx. Pilot work that recycled 30% of UPW via membrane distillation showed an 18% CapEx reduction (Intel, 2025). A dedicated Semiconductor UPW System Cost: 2026 CAPEX, OPEX & ROI Breakdown for Fabs helps procurement teams stress-test vendor quotes against these ranges.
| Cost Category | CapEx Range ($/1,000 m³/day) (2026 Est.) | OpEx Range ($/m³) (2026 Est.) | Key Cost Drivers |
|---|---|---|---|
| Equipment (RO, EDI, UV, UF) | $600,000 - $1,800,000 | $0.10 - $0.25 (Energy, consumables) | Technology selection, redundancy, automation level. |
| Installation & Commissioning | $200,000 - $600,000 | N/A | Site complexity, labor rates. |
| Automation & Monitoring | $150,000 - $400,000 | $0.05 - $0.15 (Software, sensors, maintenance) | Level of integration, real-time analytics. |
| Redundancy (N+1) | $100,000 - $300,000 | N/A | Number of critical units with backup. |
| Energy | N/A | $0.30 - $0.60 | Pumping, UV lamps, EDI power; influenced by recovery rates. |
| Chemicals & Media | N/A | $0.10 - $0.20 (Resin regeneration, cleaning agents) | Type of polishing technology, frequency of regeneration. |
| Labor & Maintenance | N/A | $0.15 - $0.30 | Operator skill, preventive maintenance schedule. |
| Total Estimated Range | $1.2M - $4.0M | $0.80 - $1.50 |
Semiconductor UPW System Redundancy and Loop Design for Fab Expansion
Loop design should carry spare flow for tool adds, hot-UPW branches, and maintenance bypass without dropping point-of-use quality. Engineers usually size recirculation, UF barriers, and polishing capacity so resistivity, TOC, and particle counters stay inside the table limits above during peak draw. Minimum piping and loop data packages should list design flow, return ratio, temperature windows, sample points, and alarm setpoints for resistivity, TOC, particles, silica, boron, dissolved oxygen, and bacteria.
Distribution materials matter as much as hydraulics. Wikipedia's ultrapure water overview notes that most steel was removed from microelectronics UPW systems in the 1980s and replaced with fluoropolymers (PVDF, PFA, ECTFE, PTFE) to avoid metallic contamination. When campus utilities sit outside the clean UPW envelope, segregated sanitary or low-strength streams can feed an Underground Package Sewage Treatment Plant (WSZ Series) instead of loading the ultrapure train. That split keeps expansion margins focused on polishing-loop hydraulics rather than mixed wastewater duty.
What Should US CHIPS Act Fabs Prioritize in Best UPW System Designs?
New US CHIPS Act capacity still faces the same physics: purity drift, biofilm, and single-train outages erase output faster than most CapEx deltas. Best UPW system designs for these fabs prioritize SEMI-aligned purity proof, N+1 failover, and online TOC, resistivity, and particle analytics before chasing exotic features. Apply equipment risk selection criteria when scoring FAT data, spare-parts lead times, and automatic switchover behavior.
Factory Acceptance Testing should verify resistivity stability for 72 hours at 18.2 MΩ·cm, TOC below 1 ppb, and particles below 100/mL for sizes greater than 0.05 μm. Underestimating resin or media replacement can inflate OpEx by up to 30%, so consumable contracts belong in the same review as hardware quotes.
| Selection Criterion | Key Considerations | Risk Mitigation Strategy |
|---|---|---|
| 1. SEMI F63-0921 & ITRS 2026 Compliance | Purity parameters (Resistivity, TOC, Particles, etc.). | Verify with independent test reports and certifications. |
| 2. Redundancy & Failover | N+1 configurations for critical components (RO, EDI). | Ensure automatic switchover and minimal production impact during maintenance or failure. |
| 3. Automation & Monitoring | Real-time analytics, SCADA integration, remote diagnostics. | Prioritize systems with advanced alarming and data logging for predictive maintenance. |
| 4. Footprint & Modularity | Space constraints, ease of installation, scalability. | Request detailed layout drawings; consider modular designs for faster deployment. |
| 5. Vendor Support & Lifecycle | Spare parts availability, technical expertise, service response time. | Assess vendor track record, warranty terms, and long-term service agreements. Link: /product/6-reverse-osmosis-ro-water-purification.html, /product/5-jy-integrated-water-purification.html |
UPW System Troubleshooting: Diagnosing and Fixing Common Failures
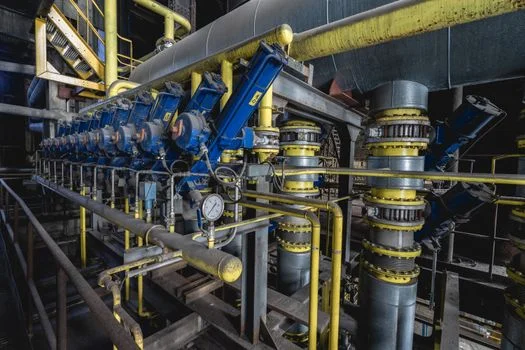
Resistivity drift between 17.5–18.0 MΩ·cm often signals CO₂ ingress, exhausted mixed-bed resin, or depleted EDI modules. Regeneration or module replacement restores the loop when ionic capacity is spent. A TOC spike above 2 ppb usually points to weak UV oxidation; confirm lamp output and keep dose at or above 1,000 mJ/cm².
Particle counts above 200/mL commonly mean UF integrity loss, so membranes need inspection or replacement. Preventive practice replaces UV lamps every 9,000 hours and regenerates mixed-bed resins every 3–6 months by load. For biofilm events, a ClO₂ shock dose at 5 ppm for 4 hours, then a flush with 0.1 μm UF-filtered water, remains a proven remediation path. On-site generators such as /product/11-chlorine-dioxide-generator.html support that sequence without bulk chemical storage.
| Symptom | Potential Causes | Troubleshooting Steps & Solutions |
|---|---|---|
| Resistivity Drift (e.g., 17.5–18.0 MΩ·cm) | CO₂ ingress, exhausted ion exchange resin, depleted EDI modules. | Check for leaks in distribution lines. Regenerate mixed-bed resin or replace EDI modules. Monitor online TOC for organic breakthroughs. |
| TOC Spike (>2 ppb) | UV lamp aging/failure, insufficient UV dose, organic breakthrough from upstream stages. | Verify UV lamp output and UV dose (target ≥ 1,000 mJ/cm²). Replace UV lamps as per schedule. Inspect RO membrane performance for organic rejection. |
| Particle Count Increase (>200/mL for >0.05 μm) | UF membrane integrity failure, upstream filter breach, biofilm growth. | Perform UF membrane integrity testing. Inspect and replace upstream filters. Implement bio-control measures (e.g., ClO₂ treatment). |
| High Silica Levels (>10 ppb) | RO membrane fouling or scaling, insufficient RO rejection. | Clean RO membranes. Evaluate RO membrane condition and consider replacement. Optimize pre-treatment to prevent silica scaling. |
| Ion Concentration Increase (e.g., Na⁺, Cl⁻) | RO membrane failure, EDI module fouling, ion exchange resin exhaustion. | Monitor RO permeate conductivity. Clean or replace EDI modules. Regenerate or replace ion exchange resins. |
Who This Is For / Who Should Look Elsewhere / Next Step
This guide is for fab process engineers, UPW owners, and procurement teams comparing 2026 purity tables, train layouts, and CapEx/OpEx envelopes. Municipal or food-plant buyers seeking conventional wastewater packages should look elsewhere, as the purity and redundancy rules here are semiconductor-specific. If you need a vendor shortlist review against FAT resistivity, TOC, and particle evidence, share your design flow and node purity targets through the inquiry form for a scoped equipment check.
Frequently Asked Questions
What is the primary function of a semiconductor UPW system?
A semiconductor UPW system produces water with extremely low ions, particles, organics, and microbes so wafer processes avoid defects and protect device yield. Delivering that water continuously, at specification, matters as much as its purity. Every stage from pretreatment to the polishing loop exists to keep ionic, organic, and particle drift off the wafer.
What differs between SEMI F63-0921 and ITRS 2026 purity parameters?
ITRS 2026 projections tighten TOC and particle limits versus SEMI F63-0921 to support next-generation nodes and advanced process steps. In the table above, TOC moves from below 1.0 ppb to below 0.5 ppb, and particles above 0.05 μm from under 100/mL to under 50/mL. Fabs design to the tighter column whenever EUV lithography is in scope.
What are the semiconductor ultrapure water resistivity and TOC limits for 2026?
Semiconductor ultrapure water resistivity and TOC limits for 2026 hold at ≥18.2 MΩ·cm and TOC below 1 ppb on SEMI F63-0921 baselines, with ITRS projections at below 0.5 ppb TOC. Reference physics caps the ceiling, since pure water shows 18.18 MΩ·cm at 25 °C. Advanced nodes therefore treat 18.2 as a floor to hold continuously, not a peak to touch.
When is mixed-bed polishing preferred over EDI?
Mixed-bed polishing often fits smaller UPW plants under 1,000 m³/day because CapEx starts lower, while larger fabs usually favor EDI for OpEx and chemical reduction. Hybrid trains pair EDI with a small mixed-bed polisher when peak purity and long run cycles both matter. Feed hardness and silica limits decide whether EDI is even eligible at a given site.
How much does a typical 3,000 m³/day UPW system cost?
CapEx can range from $3.6 million to $12 million, with OpEx about $0.80 to $1.50 per cubic meter depending on technology, redundancy, and operating efficiency. The build-up table above shows equipment at $600,000–$1,800,000 per 1,000 m³/day as the largest slice. Automation scope and N+1 redundancy move the total faster than polishing-technology choice does.
What does UV oxidation do in a UPW train?
UV at 185/254 nm breaks dissolved organics into CO₂ and H₂O, which is how plants drive TOC into the sub-ppb band required for advanced manufacturing. Dose holds at about 1,000 mJ/cm², and lamps are replaced on schedule near 9,000 hours. Weak UV oxidation is the first suspect whenever TOC spikes above 2 ppb.
How is biofilm managed in UPW loops?
Keep nutrients low, maintain disinfection, flush with high-purity water, and use ClO₂ shock dosing when needed, including on-site generation where logistics favor it. A proven sequence doses ClO₂ at 5 ppm for 4 hours, then flushes with 0.1 μm UF-filtered water. Continuous recirculation also denies biofilm the stagnation it needs to establish.
Why use hot UPW?
Hot UPW at 80–90°C raises chemical solubility and reaction rates in selected clean and etch steps, and it needs specialized heating and distribution hardware. The hot branch is usually segregated from the ambient loop so return water does not disturb point-of-use temperature windows. Only tools that specify it justify the added energy and materials cost.
What drives OpEx for UPW production?
Energy is about 40% of OpEx, followed by regeneration chemicals, RO/UF consumables, and labor for operation and maintenance. High-recovery RO trades up to 25% more energy for lower raw-water demand, so recovery setpoints belong in the operating plan. Underestimating resin and media replacement can inflate OpEx by up to 30% across a contract.
Why is redundancy required in fab UPW systems?
A UPW outage can stop production within hours, so N+1 coverage on critical skids protects continuous supply and fab output. At an estimated $3 million per day of lost output at a 7nm fab, one avoided outage pays for years of standby capacity. Automatic switchover, not just installed spares, is what makes redundancy real.
How does water recycling change UPW design cost?
Returning treated spent UPW can cut raw-water demand and shrink primary generation capacity; pilot work recycling 30% via membrane distillation showed an 18% CapEx reduction (Intel, 2025). Recycling shifts design effort toward reclaim interfaces and tighter TOC control on the return leg. Electrocoagulation case notes cover adjacent utility streams when reclaim mixes in industrial wastewater.