What Is an MBR Membrane Bioreactor?
MBR engineering specs describe a process that pairs biological treatment with membrane filtration, typically near 0.1 μm pore size, to produce near-reuse-quality permeate. Systems commonly deliver 92–97% COD removal and near-100% TSS removal. Versus conventional activated sludge at equal capacity, footprint often falls about 60%, while energy and membrane OPEX remain the main trade-offs.
An MBR replaces secondary clarifiers and tertiary sand filters with a physical barrier. Mixed liquor can run at higher biomass, typically 10–15 g/L MLSS versus 3–5 g/L in CAS, so bioreactor volume shrinks. That combination of solids retention and fine filtration is why many space-constrained municipal and industrial plants specify MBR when reuse or tight discharge limits apply.
How MBR Systems Work: Immersed vs External Configurations
MBR process trains use a suspended-growth bioreactor plus a membrane solid–liquid barrier. Microorganisms degrade organics in the aeration tank first. Membranes then separate permeate from mixed liquor instead of relying on gravity settling in a secondary clarifier. Because solids leave only as waste sludge, sludge retention time (SRT) can be set independently of hydraulic retention time (HRT).
Two main layouts dominate practice: immersed (iMBR) and external cross-flow. Immersed systems place modules in the tank or a dedicated membrane tank and draw permeate under vacuum or low pressure. External systems pump mixed liquor across membranes outside the bioreactor. Immersed duty is usually preferred for municipal and many industrial flows. Scour air and permeate pumping typically use far less energy than high-velocity cross-flow loops. Vendor data for HydropureWater DF Series modules cite roughly 10–20 times lower energy than external cross-flow for comparable flux duty.
In an immersed train, treated water is pulled through the membrane while bulk liquor stays at ambient pressure. Modules with about 0.1 μm nominal pores retain suspended solids and bacteria and can reject a share of viruses. That barrier function is why MBR permeate often meets reuse TSS and turbidity targets without a separate sand filter. For packaged trains, an MBR Membrane Bioreactor Wastewater Treatment System integrates bioreactor, membranes, and controls in one skid for smaller industrial loads.
MBR Engineering Specs: Pore Size, Flux, and Materials
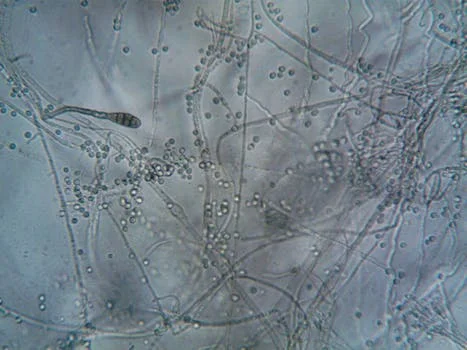
Membrane material, pore size, and sustainable flux set the design envelope. PVDF and PTFE dominate because of chemical resistance, mechanical strength, and wetability that help limit irreversible fouling. PVDF hollow-fiber or flat-sheet modules, including HydropureWater DF Series MBR membrane modules, are specified across wide pH and oxidant ranges used in CIP.
Pore sizes typically fall between 0.04 and 0.4 μm (MF/UF). That range supports near-100% TSS and bacterial retention when integrity is maintained. Net flux is stated in LMH (L/(m²·h)). Municipal feeds often run about 15–30 LMH. Higher-fouling industrial feeds usually stay nearer 10–20 LMH to keep transmembrane pressure (TMP) recoverable. Air scour across the membrane face supplies shear that limits cake buildup; DF Series modules use an integrated aeration box for that duty. Membrane service life is commonly 5–10 years under controlled cleaning. Replacement modules often represent about 10–20% of initial CAPEX over the life cycle.
| Parameter | Typical Range / Specification | Notes / Impact |
|---|---|---|
| Membrane Material | PVDF, PTFE | Chemical resistance, durability, hydrophilicity |
| Pore Size | 0.04 – 0.4 μm | Determines filtration efficiency (MF/UF) |
| Flux Rate (Municipal) | 15 – 30 LMH | Higher rates for lower fouling potential |
| Flux Rate (Industrial) | 10 – 20 LMH | Lower rates for higher organic load/fouling |
| Membrane Scouring | Integrated aeration | Reduces fouling, maintains flux |
| Membrane Lifespan | 5 – 10 years | Affected by operation, cleaning, influent |
| Replacement Cost | 10 – 20% of CAPEX | Significant operational expenditure |
Efficiency Metrics: COD, BOD, TSS, and Nutrient Removal
Against published MBR engineering specs for municipal-strength wastewater, MBR trains typically remove 92–97% COD. That band applies when influent COD sits between about 50–500 mg/L and reflects combined biological oxidation and solids capture. BOD removal commonly reaches 95–99%, above the roughly 85–95% range reported for many CAS plants without tertiary filtration. Earlier vendor summaries sometimes labeled these figures as “EPA 2024 benchmarks.” Published EPA MBR work verified for this update is the 2016 LCA report EPA/600/R-16/243. It covers decentralized MBR scale and reuse energy, not a 2024 COD efficiency table.
TSS removal approaches 100%, with permeate often below 1 mg/L TSS, versus about 90–95% TSS removal (roughly 5–30 mg/L effluent) for clarifier-based CAS. Total nitrogen removal of about 70–90% is achievable when nitrification and denitrification zones or intermittent aeration are designed into the bioreactor. Long SRT supports complete ammonia oxidation; anoxic volume converts nitrate to N₂ gas. Phosphorus removal of about 50–80% is typical when ferric or aluminum salts are dosed; biological P alone is less stable under industrial load swings.
| Pollutant Parameter | MBR Removal Efficiency | Conventional Activated Sludge (CAS) Removal Efficiency | Notes |
|---|---|---|---|
| COD Removal | 92 – 97% | 75 – 90% | For influent 50–500 mg/L |
| BOD Removal | 95 – 99% | 85 – 95% | Superior organic load reduction |
| TSS Removal | Near 100% (<1 mg/L) | 90 – 95% (5–30 mg/L) | Eliminates need for secondary clarifiers |
| Nitrogen Removal | 70 – 90% | 50 – 80% | Via nitrification/denitrification |
| Phosphorus Removal | 50 – 80% (with chemical dosing) | 30 – 60% (biological) | Consistent removal with chemical aid |
MBR vs Conventional Treatment: Footprint, Cost, and Effluent
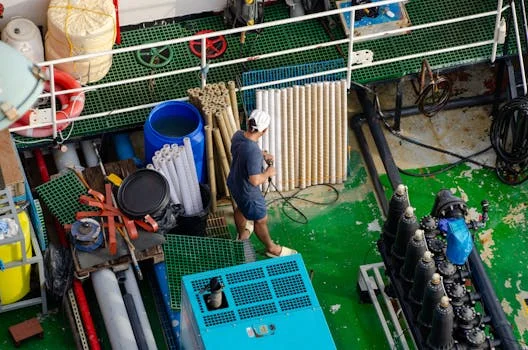
MBR versus CAS selection turns on footprint, CAPEX, OPEX, effluent targets, and staffing skill. For equal hydraulic capacity, MBR plants often need about 60% less area than CAS trains that still include clarifiers and tertiary filters, which matters on urban or brownfield sites. CAPEX is typically 20–40% higher, driven by membranes and instrumentation. Example ranges used in prior engineering estimates: about $80,000–$120,000 for a 10 m³/day package, and about $1.5M–$2.5M for a 1,000 m³/day plant, before site-specific civil works.
OPEX is often 10–30% higher than CAS because of membrane replacement, scour and process aeration, permeate pumping, and CIP chemicals. Some chemical cost can fall when coagulants for tertiary polishing are no longer needed. Effluent quality is the usual payoff: permeate commonly meets reuse-oriented targets such as <1 mg/L TSS and <10 mg/L BOD, so direct non-potable reuse or discharge without extra filtration is often feasible. For a CAPEX/OPEX side-by-side with extended aeration, see the MBR vs extended aeration cost breakdown.
Energy framing needs care. Older summaries claimed roughly 30% better energy efficiency than CAS. Plant total energy still depends heavily on aeration. According to the California Energy Commission (2024), conventional aerobic secondary treatment typically uses about 0.4–0.65 kWh/m³. Immersed MBR totals of about 0.5–1.5 kWh/m³ therefore sit at or above that aerobic baseline once membrane scour is included. CIP replaces clarifier blanket and scraper work, so maintenance skill shifts from mechanical settling to membrane integrity and cleaning chemistry.
| Parameter | MBR System | Conventional Activated Sludge (CAS) | Key Differentiator |
|---|---|---|---|
| Footprint Reduction | Up to 60% smaller | Larger footprint required | Space efficiency |
| CAPEX | 20 – 40% higher | Lower initial investment | Membrane cost, advanced controls |
| OPEX | 10 – 30% higher | Lower operational costs | Membrane replacement, energy for aeration/cleaning |
| Effluent Quality | Reuse standards (<1 mg/L TSS, <10 mg/L BOD) | Requires tertiary treatment (5–30 mg/L TSS, 10–30 mg/L BOD) | Direct reuse potential |
| Operational Complexity | Membrane cleaning (CIP) | Clarifier maintenance, sludge handling | Different maintenance focus |
How Does MBR Handle Peak Flows?
MBR effluent quality stays high during short peaks when net flux stays inside the sustainable envelope. MLSS must not overload the membrane tank. Designers size membrane area for average day plus a peaking factor. They then protect flux with equalization, relaxation or backflush cycles, and temporary TMP limits. Under high solids spikes, operators lower instantaneous flux and raise scour air within blower capacity. Maintenance cleans then recover permeability so flux returns without irreversible fouling. Stable permeate TSS below 1 mg/L is normal when integrity tests pass. COD and nutrient removal still follow the bioreactor’s HRT and SRT. Very short hydraulic peaks mainly stress membranes, not biology, if equalization is adequate.
What Is a Backwashable Flat Sheet MBR?
A backwashable flat sheet MBR uses stacked flat plates or sheets that can reverse permeate or apply timed backwash to lift cake from the membrane surface. Compared with continuously air-scoured hollow fiber, flat-sheet geometry often tolerates higher mixed-liquor viscosity. It also allows discrete backwash or relaxation without fiber sludging. Selection still hinges on packing density, scour energy, and CIP access; both formats meet the same 0.04–0.4 μm pore class when integrity is maintained. Specify backwashable flat sheet when industrial sludge is sticky or frequent physical cleans beat long air-scour cycles. Modular cassette replacement can also simplify outages.
Industrial Applications and Measured Outcomes
Municipal MBR plants use the process to meet tight discharge limits and enable reuse on compact sites. One cited 500 m³/day urban plant reported permeate below 5 mg/L BOD and below 1 mg/L TSS at about $0.45 per m³ treated. According to US EPA (2016), recycled water from decentralized MBR scenarios can avoid about 0.94–0.96 m³ of drinking water per cubic meter of wastewater treated, which frames the reuse value when potable offset matters.
Food processors apply MBR when COD and FOG swing hard. A dairy example cut influent COD from about 2,000 mg/L to below 50 mg/L for direct discharge compliance and reduced sludge yield versus the prior aerobic train. Pharmaceutical sites use MBR for API and micropollutant control; one manufacturing case reported over 90% rejection for selected API compounds. Medical and pharma wastewater process detail is covered in the medical wastewater treatment systems guide.
Textile dyeing plants use MBR for color and COD. One installation cut color by over 95% and COD by about 93% (from 800 mg/L to below 60 mg/L). Landfill leachate, often above 5,000 mg/L COD with high ammonia, needs aggressive CIP and aeration control; reported trains still exceed 90% COD and ammonia nitrogen removal when cleaning intervals match fouling rate. Food-industry design checklists should cover FOG pretreatment, equalization volume, and CIP chemical storage before membrane selection.
Selection Checklist and Next Step
Plant engineers should complete this short checklist before freezing an MBR basis of design:
- Influent COD/BOD, TSS, FOG, temperature, and peak-to-average flow ratio
- Required effluent or reuse limits for TSS, BOD, TN, and TP
- Available footprint versus CAS plus tertiary filtration
- Sustainable flux (LMH) at design MLSS and scour air rate
- CIP chemistry limits, downtime tolerance, and membrane replacement budget
- Energy tariff and blower redundancy for process plus scour air
- Operator skill for TMP trending and integrity testing
Who this is for: EPC and plant engineers needing reuse-grade permeate or a smaller footprint than CAS. Who should look elsewhere: sites with very low land cost, weak energy tariffs, and only secondary discharge limits where clarifiers already meet permit. Next step: share influent data and target limits to size an MBR Membrane Bioreactor Wastewater Treatment System against a CAS baseline.
Frequently Asked Questions
What is the typical MBR energy consumption?
Typical specific energy for an immersed MBR plant ranges from about 0.5 to 1.5 kWh per cubic meter of treated wastewater. That total covers process aeration, membrane scour, and permeate pumping. Side-stream cross-flow systems use more energy because of recirculation velocity. According to the California Energy Commission (2024), conventional aerobic secondary treatment often sits near 0.4–0.65 kWh/m³, so MBR totals usually meet or exceed that baseline once scour air is included.
How often does MBR membrane cleaning occur?
Physical cleaning such as permeate backflush or air scour runs many times per day to lift reversible foulants. Chemical cleaning-in-place (CIP) with sodium hypochlorite or citric acid is typically weekly to monthly, set by TMP rise and flux decline. More aggressive industrial feeds need shorter CIP intervals. Keeping a logged TMP–flux curve is the practical way to set intervals without over-cleaning and shortening membrane life.
What is the MBR cost analysis for industrial projects?
Industrial MBR cost analysis treats CAPEX as typically 20–40% above CAS because of membranes and controls, with illustrative package costs from about $80,000 at 10 m³/day to about $2.5M at 1,000 m³/day before civil works. OPEX is often 10–30% higher, driven by membrane replacement (about 10–20% of CAPEX every 5–10 years), aeration energy, and CIP chemicals. Savings appear in footprint, sludge handling, and avoided tertiary filters when reuse-grade permeate is required.
What MBR effluent quality can be expected?
MBR permeate commonly achieves TSS below 1 mg/L, BOD below 5 mg/L, and COD below 50 mg/L when biology and membranes are healthy. Nitrogen removal of about 70–90% and phosphorus removal of about 50–80% with chemical dosing are typical design bands. That clarity usually removes the need for sand filters before non-potable reuse or strict discharge, provided nutrient permits are met by the bioreactor configuration.
Can MBR recover quickly after a high-solids upset?
Yes, if operators cut net flux, keep scour within design air rates, and run a maintenance clean before irreversible fouling sets in. Equalization upstream reduces the solids spike that reaches the membrane tank. Quick recovery means TMP returns to the pre-upset band and integrity tests stay within vendor limits; repeated upsets without equalization shorten membrane life even when daily permeate quality looks acceptable.
Related Equipment
- Integrated MBR system for municipal and industrial applications — view specifications, capacity range, and technical data
Need a customized solution? Request a free quote with your specific flow rate and pollutant parameters.