Home>Blog>Buyer's Guide>Primary vs Secondary Wastewater Treatment Costs: 2026 Engineering Breakdown with Cost per kg BOD Removed
Primary vs Secondary Wastewater Treatment Costs: 2026 Engineering Breakdown with Cost per kg BOD Removed
Buyer's Guide
Zhongsheng Engineering Team
Primary vs Secondary Wastewater Treatment Costs: 2025 Engineering Breakdown with Cost per kg BOD Removed
Primary wastewater treatment costs $0.80–$1.50 per kg BOD removed, while secondary treatment costs $0.30–$0.60 per kg BOD—despite higher capital ($2,000–$5,000 per m³/day vs. $500–$1,200 for primary) and O&M ($0.15–$0.40/m³ vs. $0.05–$0.15/m³). Secondary treatment’s superior removal efficiency (85–95% BOD vs. 30–40%) often justifies the investment for plants facing strict discharge limits or reuse requirements. This guide provides 2025 cost benchmarks, engineering parameters, and a decision framework to optimize your treatment train.
Why Primary vs Secondary Treatment Costs Matter: A Plant Manager’s Dilemma
A municipal wastewater treatment plant operating at 5 MGD, relying solely on primary treatment, frequently faces annual fines exceeding $500,000 for failing to meet its biological oxygen demand (BOD) discharge limits, per EPA 2024 discharge penalty guidelines. This scenario highlights a common dilemma for plant managers and engineers: the upfront cost savings of primary-only treatment often translate into significant long-term financial penalties and operational headaches. While primary treatment systems are demonstrably cheaper to build and operate on a per-unit volume basis, their limited removal efficiency (typically 30–40% BOD) means they rarely achieve modern compliance standards. Conversely, upgrading to a secondary treatment system demands a substantially larger capital investment and higher operational expenses, yet it delivers 85–95% BOD removal, ensuring compliance and potentially enabling water reuse, which can offset costs. The critical metric for evaluating these options is not just the capital or operational expenditure, but the true **cost per kg BOD removed**, which provides a holistic measure of wastewater treatment cost efficiency by factoring in the actual pollutant reduction achieved. This metric reveals that secondary treatment, despite its higher absolute costs, often proves more cost-efficient in terms of pollutant removal.
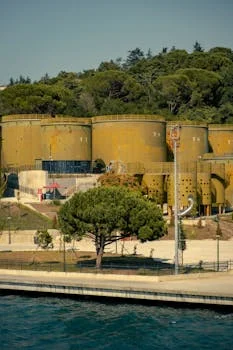
Primary vs Secondary Treatment: Process Mechanisms and Removal Efficiencies
primary vs secondary treatment cost difference - Primary vs Secondary Treatment: Process Mechanisms and Removal Efficiencies
Primary and secondary wastewater treatment stages employ fundamentally different mechanisms to remove pollutants, leading to distinct removal efficiencies and operational parameters. Primary treatment primarily relies on physical separation processes to remove large solids and a portion of organic matter. This stage typically involves screening to remove gross solids (such as through a rotary mechanical bar screen) followed by grit removal and sedimentation in primary clarifiers. These processes achieve a removal efficiency of 30–40% for BOD and 50–70% for total suspended solids (TSS), with typical hydraulic retention times (HRT) ranging from 1 to 3 hours.
Secondary treatment, on the other hand, utilizes biological processes to break down dissolved and colloidal organic matter that remains after primary treatment. Common secondary treatment technologies include activated sludge, membrane bioreactors (MBR), and trickling filters. These biological systems rely on microorganisms to consume organic pollutants under controlled conditions. For instance, activated sludge systems achieve 85–95% BOD removal and 80–90% TSS removal, requiring typical sludge retention times (SRT) of 5–15 days. MBR systems, such as an MBR membrane bioreactor, offer even higher effluent quality, often near-reuse standards, with enhanced removal of suspended solids and pathogens. Secondary treatment processes are significantly more energy-intensive, consuming approximately 0.3–0.6 kWh/m³ primarily for aeration in biological reactors. They also often require chemical inputs for nutrient removal (e.g., coagulants for phosphorus) or pH adjustment. It is important to note that primary treatment alone rarely meets modern discharge limits, such as those stipulated by the EU Urban Waste Water Directive 91/271/EEC or China’s GB 18918-2002, which typically require BOD concentrations below 25 mg/L.
Parameter
Primary Treatment
Secondary Treatment (e.g., Activated Sludge)
Main Process
Physical separation (screening, sedimentation)
Biological degradation (aerobic/anaerobic)
BOD Removal Efficiency
30–40%
85–95%
TSS Removal Efficiency
50–70%
80–90%
Nutrient Removal
Minimal
Significant (with specific processes for N/P)
Typical HRT
1–3 hours
4–8 hours (for biological reactor)
Typical SRT
N/A (physical process)
5–15 days
Energy Use
0.05–0.1 kWh/m³
0.3–0.6 kWh/m³ (mainly for aeration)
Chemical Needs
Minimal (e.g., pH adjustment, coagulants for enhanced primary)
Moderate (nutrients, disinfectants, coagulants for P removal)
Capital Costs: Primary Clarifiers vs Secondary Treatment Systems (2025 Data)
The capital expenditure for wastewater treatment systems varies significantly between primary and secondary stages, with secondary treatment requiring a substantially larger initial investment due to its complex biological and mechanical components. For primary clarifiers, adjusted 2025 capital costs range from approximately $638–$1,532 per m³/day of capacity, reflecting a 5% annual inflation rate applied to 2020 data. Factors influencing these costs include the choice of construction materials (e.g., concrete vs. steel), tank depth, and the complexity of integrated sludge handling systems. For detailed specifications, refer to 2025 primary clarifier specifications and design parameters.
In contrast, secondary treatment systems command higher capital costs, ranging from $2,000–$5,000 per m³/day capacity in 2025, largely due to the extensive infrastructure required for biological processes. The specific technology choice significantly impacts this range:
Activated Sludge Systems: Typically cost $2,500–$4,000 per m³/day. These systems require large aeration basins, secondary clarifiers, and sludge return lines.
Membrane Bioreactors (MBR): Represent a higher-end option at $4,000–$5,000 per m³/day. MBR systems, such as an MBR membrane bioreactor for near-reuse-quality effluent, offer a smaller footprint and superior effluent quality but incur higher costs due to the specialized membranes and associated maintenance.
Trickling Filters: Generally range from $2,000–$3,500 per m³/day. While often less energy-intensive than activated sludge, they require large land areas and specialized media.
Key cost drivers for secondary treatment include the aeration system (blowers, diffusers), membrane replacement costs for MBRs, and the overall civil works for larger biological reactors. For a clearer perspective on capacity, consider a 10 MGD (37,854 m³/day) plant: its primary treatment capital cost would typically fall between $3.8M–$9.1M, while a comprehensive secondary treatment system could range from $15M–$38M. A compact secondary treatment system combining A/O biological contact oxidation and sedimentation, like a WSZ series underground integrated sewage treatment plant, can offer a space-saving solution, though its per-unit cost aligns with general secondary treatment benchmarks.
Operational Costs: Energy, Chemicals, and Labor for Primary vs Secondary Treatment
primary vs secondary treatment cost difference - Operational Costs: Energy, Chemicals, and Labor for Primary vs Secondary Treatment
Operational and maintenance (O&M) costs represent a significant long-term financial commitment for wastewater treatment plants, with secondary treatment typically incurring higher expenses across all major categories compared to primary treatment. The primary drivers for this difference are increased energy consumption for biological processes, greater chemical usage for advanced pollutant removal, and a larger, more skilled labor force.
Energy costs are a dominant factor for secondary treatment. Primary treatment facilities typically consume 0.05–0.1 kWh/m³ for pumping and mechanical screening, translating to $0.005–$0.02/m³ at an average electricity cost of $0.10/kWh. In contrast, secondary treatment, particularly activated sludge systems, requires substantial energy for aeration, consuming 0.3–0.6 kWh/m³, or $0.03–$0.06/m³. This difference is a major contributor to the overall higher O&M for secondary systems, as detailed in EPA 2024 energy benchmarks.
Chemical costs also escalate significantly with secondary treatment. Primary treatment might require $0.01–$0.03/m³ for occasional coagulants (for enhanced primary treatment) or pH adjustment. Secondary treatment, however, often necessitates $0.05–$0.15/m³ for nutrient addition (if influent is nutrient-deficient), disinfectants (e.g., chlorine dioxide), and membrane cleaning chemicals for MBR systems. For an engineering guide to wastewater treatment chemicals and their cost impacts, additional resources are available. When normalized, the chemical cost per kg BOD removed for secondary treatment can range from $0.10–$0.20/kg BOD.
Labor costs are also higher for secondary treatment due to the increased complexity and demand for specialized skills. A 1 MGD primary treatment plant might require 0.1–0.3 Full-Time Equivalent (FTE) personnel for routine operation and maintenance. A 1 MGD secondary treatment plant, especially one utilizing MBR technology, typically requires 0.5–1.5 FTEs, reflecting the need for process control, biological monitoring, and membrane maintenance, as per EPA 2024 labor cost benchmarks.
To illustrate, consider the annual O&M cost for a 5 MGD (18,927 m³/day) plant. Primary treatment would incur annual O&M costs between $90K–$270K. Upgrading to secondary treatment would elevate these annual O&M expenses to $270K–$720K, demonstrating the substantial long-term financial impact.
O&M Cost Component
Primary Treatment (per m³)
Secondary Treatment (per m³)
Primary Treatment (5 MGD Annual)
Secondary Treatment (5 MGD Annual)
Energy (kWh/m³)
0.05–0.1 kWh/m³
0.3–0.6 kWh/m³
$34.5K–$69K
$207K–$414K
Energy Cost ($/m³ at $0.10/kWh)
$0.005–$0.01
$0.03–$0.06
$34.5K–$69K
$207K–$414K
Chemicals ($/m³)
$0.01–$0.03
$0.05–$0.15
$69K–$207K
$345K–$1.03M
Labor (FTE for 5 MGD)
0.5–1.5 FTE
2.5–7.5 FTE
$50K–$150K (estimated at $100K/FTE)
$250K–$750K (estimated at $100K/FTE)
Total O&M Cost (per m³)
$0.05–$0.15
$0.15–$0.40
$90K–$270K (Total Annual)
$270K–$720K (Total Annual)
Cost per kg BOD Removed: The True Measure of Treatment Efficiency
The most accurate metric for evaluating the true cost-efficiency of wastewater treatment is the **cost per kg BOD removed**, which normalizes expenses against the actual pollutant reduction achieved. This metric is calculated by dividing the total annual costs (amortized capital plus annual O&M) by the total kilograms of BOD removed per year. For primary treatment, the cost typically ranges from $0.80–$1.50 per kg BOD removed, while secondary treatment, despite its higher absolute capital and O&M, achieves a significantly lower cost of $0.30–$0.60 per kg BOD removed. This meta-analysis finding underscores why secondary treatment is often more economically efficient in the long run.
Secondary treatment demonstrates superior cost-efficiency because its significantly higher removal efficiency (85–95% BOD compared to primary's 30–40%) spreads the fixed and variable costs over a much larger quantity of pollutants removed. This effectively lowers the unit cost of treatment for each kilogram of BOD.
To illustrate with a step-by-step calculation for a 1 MGD (3,785 m³/day) plant with an influent BOD concentration of 200 mg/L:
Calculate Influent BOD Load: 3,785 m³/day × 200 mg/L × (1 kg / 1,000,000 mg) = 757 kg BOD/day.
Calculate Annual BOD Removed (Primary Treatment):
Assume 35% BOD removal efficiency: 757 kg/day × 0.35 = 265 kg BOD/day.
Annual BOD removed: 265 kg/day × 365 days/year = 96,725 kg BOD/year.
If the cost per kg BOD removed is $1.20 (within the $0.80–$1.50 range), then the estimated total annual cost for primary treatment is $1.20/kg × 96,725 kg = $116,070/year.
Calculate Annual BOD Removed (Secondary Treatment):
Assume 90% BOD removal efficiency: 757 kg/day × 0.90 = 681 kg BOD/day.
Annual BOD removed: 681 kg/day × 365 days/year = 248,565 kg BOD/year.
If the cost per kg BOD removed is $0.45 (within the $0.30–$0.60 range), then the estimated total annual cost for secondary treatment is $0.45/kg × 248,565 kg = $111,854/year.
This example clearly shows that while secondary treatment has higher nominal capital and O&M, its superior removal efficiency results in a lower cost per kg BOD removed, making it a more efficient investment for pollutant reduction. It’s important to note that this metric does not explicitly account for the financial impact of compliance fines or the potential revenue from water reuse, which can further enhance the economic viability of advanced treatment.
Influent BOD (mg/L)
Primary Treatment Cost per kg BOD Removed
Secondary Treatment Cost per kg BOD Removed
100
$1.50
$0.60
200
$1.20
$0.45
300
$1.00
$0.38
400
$0.90
$0.35
500
$0.80
$0.30
When to Choose Primary-Only Treatment: Use Cases and Cost Trade-Offs
primary vs secondary treatment cost difference - When to Choose Primary-Only Treatment: Use Cases and Cost Trade-Offs
While secondary treatment offers superior pollutant removal and lower cost per kg BOD, there are specific scenarios where primary-only treatment remains a viable and cost-effective solution. These use cases are primarily dictated by influent wastewater characteristics, local discharge regulations, and budgetary constraints.
Primary treatment may suffice for facilities handling low-strength wastewater, typically characterized by BOD concentrations below 150 mg/L and TSS below 200 mg/L. In such cases, the inherent pollutant load is low enough that basic physical separation can achieve a satisfactory level of treatment. Additionally, primary treatment is often adequate as a pre-treatment step for specific industrial reuse applications, such as cooling water or process water where only gross solids and a portion of organics need to be removed before further specialized treatment.
Discharge limits are a crucial determinant. In some regions, particularly rural areas in developing countries (e.g., certain parts of India or Africa), environmental regulations may be less stringent, allowing for discharge limits as high as BOD < 100 mg/L and TSS < 60 mg/L. In these instances, primary treatment alone can meet the required effluent quality without the significant investment in biological processes.
Budget constraints are a major factor. Primary treatment systems are typically 30–50% cheaper in capital costs and 50–70% cheaper in O&M compared to full secondary treatment. For a 1 MGD plant, this translates to roughly $1.2M in capital and $50K/year in O&M for primary treatment, versus $3M in capital and $200K/year in O&M for secondary treatment. When capital is severely limited and discharge requirements are lenient, primary treatment offers an accessible entry point to wastewater management.
A hybrid approach, known as enhanced primary treatment, offers a middle ground. By integrating chemical coagulation and flocculation followed by a high-efficiency DAF system for enhanced primary treatment or pre-treatment, it is possible to achieve 60–70% BOD removal. This can approach the lower end of secondary treatment performance at a significantly reduced cost, often 50–60% of a full secondary system, as indicated by EPA 2024 data on enhanced primary treatment. This hybrid option can be particularly attractive for industrial facilities needing improved pre-treatment or municipalities with slightly elevated discharge requirements but limited budgets.
Decision Framework: Selecting the Right Treatment Level for Your Plant
Selecting the optimal wastewater treatment level requires a structured evaluation of technical, financial, and regulatory factors. This decision framework guides plant engineers, procurement managers, and environmental consultants in making informed choices:
Step 1: Assess Influent Quality and Discharge Limits.
Thoroughly characterize your raw influent wastewater for key parameters like BOD, TSS, COD, nitrogen (Ammonia-N, Total-N), and phosphorus (Total-P).
Identify all applicable local, regional, and national discharge regulations. Compare your influent characteristics against these limits to determine the required removal efficiencies. For example, EU Urban Waste Water Directive (91/271/EEC) typically mandates <25 mg/L BOD, while some US EPA NPDES permits may require <10 mg/L BOD for sensitive receiving waters.
Step 2: Estimate Capital and O&M Costs for Each Option.
Utilize the cost benchmarks from previous sections for primary, primary + chemical (enhanced primary), and secondary treatment (e.g., activated sludge, MBR).
A simplified capital cost estimation formula can be: Capital Cost = Flow (m³/day) × Cost per m³/day. Similarly, annual O&M can be estimated.
Factor in the potential for future expansion and the associated capital costs.
Step 3: Calculate Cost per kg BOD Removed and Evaluate Compliance Risk.
Perform a cost per kg BOD removed calculation for each treatment option using the methodology outlined previously. This metric provides the true cost-efficiency.
Quantify the financial risk of non-compliance (potential fines, legal fees, reputational damage) if discharge limits are not consistently met by a lower-cost option.
Consider the value of treated effluent for reuse, which can offset O&M costs, especially for secondary or advanced secondary treatment.
Step 4: Consider Non-Cost Factors and Develop a Decision Matrix.
Footprint: MBR systems offer a significantly smaller footprint but higher capital and O&M than conventional activated sludge.
Odor Control: Biological processes can generate odors requiring additional mitigation.
Sludge Handling: Increased treatment levels generate more sludge, impacting sludge dewatering cost benchmarks and equipment selection.
Operator Skill Level: Secondary treatment requires more skilled operators.
Future Expansion: Design for modularity and ease of upgrade.
Case Study: A 2 MGD textile plant in Bangladesh, facing moderate discharge limits, opted for an enhanced primary treatment solution combining chemical coagulation with a high-efficiency DAF system instead of a full secondary biological plant. This hybrid approach achieved 65% BOD removal, meeting their specific discharge permit, and reduced overall project costs by an estimated 40% compared to a conventional activated sludge system, while still providing robust pre-treatment for potential future expansion or stricter limits. This demonstrates the value of exploring middle-ground options based on specific needs.
Decision Factor
Primary Treatment
Enhanced Primary (Primary + Chemical/DAF)
Secondary Treatment
Influent BOD (mg/L)
<150
150–300
>200
Discharge BOD Limit (mg/L)
>80
30–80
<30 (or for reuse)
Capital Cost (Relative)
Lowest
Moderate (50-60% of Secondary)
Highest
O&M Cost (Relative)
Lowest
Moderate (60-70% of Secondary)
Highest
Cost per kg BOD Removed
Highest ($0.80–$1.50)
Moderate ($0.50–$0.90)
Lowest ($0.30–$0.60)
Compliance Risk
High (for modern limits)
Moderate
Low
Footprint
Small
Small to Medium
Medium to Large (MBR smaller)
Operator Skill
Basic
Intermediate
Advanced
Frequently Asked Questions
Why is secondary treatment more expensive than primary?
Secondary treatment is more expensive than primary treatment primarily due to its higher energy, chemical, and labor requirements. Biological processes, which are central to secondary treatment, necessitate significant aeration, consuming 0.3–0.6 kWh/m³ for blowers and diffusers, compared to 0.05–0.1 kWh/m³ for primary treatment. Additionally, secondary systems often require more specialized chemicals for nutrient removal or disinfection, and a larger, more skilled labor force for process control and maintenance.
Can primary treatment meet EPA discharge limits?
No, primary treatment alone rarely meets modern EPA discharge limits for municipal wastewater. Primary treatment typically removes only 30–40% of BOD and 50–70% of TSS. EPA discharge limits for BOD are often stringent, commonly requiring effluent concentrations below 30 mg/L, which primary treatment cannot consistently achieve from typical influent wastewater.
What’s the payback period for upgrading from primary to secondary treatment?
The payback period for upgrading from primary to secondary treatment typically ranges from 3 to 7 years. This period depends heavily on factors such as the severity of non-compliance fines, the avoided costs of continuous penalties, potential revenue generated from water reuse (e.g., for irrigation or industrial processes), and the operational cost differences (energy, chemicals, labor). A simple ROI formula is: Payback = (Capital Cost Difference) / (Annual Savings from Fines + Annual Reuse Value – Annual O&M Cost Difference).
Is there a middle-ground option between primary and secondary treatment?
Yes, enhanced primary treatment offers an effective middle-ground option. This approach typically involves primary treatment combined with chemical coagulation/flocculation and separation technologies like dissolved air flotation (DAF). Enhanced primary treatment can achieve 60–70% BOD removal, significantly better than conventional primary treatment, at approximately 50–60% of the capital and O&M costs of a full secondary treatment system. This makes it a viable solution for facilities with moderate discharge limits or as a robust pre-treatment stage.
How do MBR systems compare to conventional activated sludge in cost?
MBR (Membrane Bioreactor) systems generally have 20–30% higher capital costs than conventional activated sludge systems, primarily due to the specialized membranes and associated infrastructure. However, MBRs often exhibit 10–20% lower O&M costs in the long run, attributable to their significantly smaller footprint (reducing land costs), higher effluent quality (potentially reducing post-treatment needs), and reduced sludge production. The higher capital is often justified by superior effluent quality, reduced land requirements, and operational stability.
Our team of wastewater treatment engineers has over 15 years of experience designing and manufacturing DAF systems, MBR bioreactors, and packaged treatment plants for clients in 30+ countries worldwide.