Home>Blog>Buyer's Guide>Secondary vs Tertiary Wastewater Treatment Costs: 2026 Engineering Breakdown with ROI Calculator
Secondary vs Tertiary Wastewater Treatment Costs: 2026 Engineering Breakdown with ROI Calculator
Buyer's Guide
Zhongsheng Engineering Team
Why the Cost Difference Between Secondary and Tertiary Treatment Matters
Industrial facilities, particularly those in water-intensive sectors like textiles, face significant financial penalties for exceeding permitted effluent discharge limits, making the cost difference between secondary and tertiary wastewater treatment a critical risk mitigation factor. Consider a large textile factory in Bangladesh, which in 2024 faced cumulative fines exceeding $150,000 annually for consistently exceeding discharge limits for Total Suspended Solids (TSS) and Chemical Oxygen Demand (COD), violating local Department of Environment regulations. Implementing a tertiary treatment system, such as a Dissolved Air Flotation (DAF) unit or a Membrane Bioreactor (MBR), could reduce these non-compliance fines by over 90% while simultaneously enabling water reuse for non-potable applications like cooling towers, generating additional revenue.
The economic decision between secondary and tertiary treatment involves a crucial trade-off: higher upfront capital expenditure versus substantial long-term operational savings and revenue opportunities. For many municipal wastewater treatment plants, capital (investment) costs historically covered 58% of the total cost for preliminary treatment, while operational and maintenance (O&M) costs had the highest share (58%) in tertiary treatment facilities, according to a comparative evaluation of municipal WWTPs in Istanbul. This highlights a shift in cost distribution as treatment complexity increases. The three primary cost drivers influencing this decision are initial capital investment, ongoing operational and maintenance expenses, and energy consumption, which often dominates O&M budgets for advanced tertiary systems.
Secondary vs Tertiary Treatment: Process Mechanisms and Effluent Quality
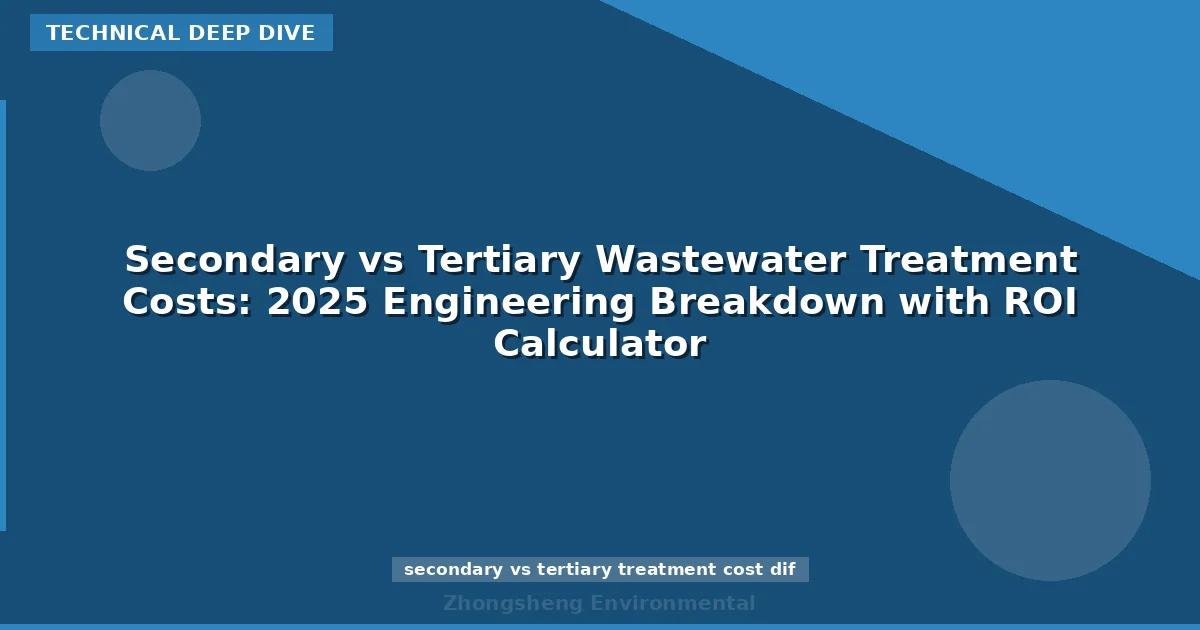
Secondary wastewater treatment primarily utilizes biological processes to remove dissolved organic matter, whereas tertiary treatment employs advanced physical and chemical methods to achieve significantly higher effluent quality for stringent discharge or reuse applications. Secondary treatment systems, such as activated sludge or anaerobic/aerobic (A/O) processes, rely on microorganisms to consume dissolved organic contaminants like sugars and oils, typically achieving 85–95% removal efficiency for Biochemical Oxygen Demand (BOD) and Chemical Oxygen Demand (COD). This level of treatment is generally sufficient for discharge into less sensitive receiving waters.
Tertiary treatment, also known as advanced treatment, builds upon secondary treatment to remove remaining suspended solids, nutrients (nitrogen and phosphorus), and pathogens. Common tertiary processes include physical separation methods like Dissolved Air Flotation (DAF) – Zhongsheng Environmental’s ZSQ series DAF systems for high-efficiency tertiary treatment are an example – membrane filtration (such as MBR systems for near-reuse-quality effluent in compact footprints), and advanced oxidation. These processes achieve 95–99% removal efficiency for a broader range of pollutants. The increased complexity of tertiary treatment necessitates additional equipment, such as specialized membranes, chemical dosing systems, and sophisticated automation, contributing to higher upfront and specific operational costs.
The difference in process mechanisms directly translates to distinct effluent quality benchmarks. Secondary treatment typically achieves BOD levels below 30 mg/L and Total Suspended Solids (TSS) below 30 mg/L. In contrast, tertiary treatment can produce effluent with BOD below 10 mg/L, TSS below 5 mg/L, and Total Nitrogen (TN) often reduced to below 15 mg/L, making it suitable for direct discharge into sensitive ecosystems or for various reuse applications.
Feature
Secondary Treatment
Tertiary Treatment
Primary Goal
BOD/COD removal, basic solids reduction
Nutrient removal, pathogen inactivation, advanced solids removal, water reuse preparation
Physical/Chemical (DAF, MBR, RO, UV disinfection, Chemical Coagulation/Flocculation)
Typical Efficiency (BOD/COD)
85–95%
95–99%
Effluent Quality (BOD)
<30 mg/L
<10 mg/L
Effluent Quality (TSS)
<30 mg/L
<5 mg/L
Nutrient Removal
Limited (some N/P)
High (TN <15 mg/L, TP <1 mg/L)
Complexity
Moderate
High
Capital Costs: Secondary vs Tertiary Treatment Breakdown
secondary vs tertiary treatment cost difference - Capital Costs: Secondary vs Tertiary Treatment Breakdown
The initial capital investment for wastewater treatment infrastructure varies significantly between secondary and tertiary systems, with tertiary solutions typically incurring higher upfront costs due to increased equipment complexity and required footprint. For general industrial and municipal applications, secondary treatment typically demands $0.20–$0.50 per cubic meter of capacity, while tertiary treatment systems range from $0.40–$1.00 per cubic meter of capacity. This reflects that capital investment often constitutes a larger portion of the total cost for secondary systems, while O&M dominates tertiary systems.
Equipment-specific capital costs illustrate this divergence further. Conventional activated sludge systems, a common secondary treatment technology, typically cost between $500–$1,200 per m³/day of capacity. In contrast, advanced tertiary technologies like Membrane Bioreactors (MBR) can range from $1,500–$3,000 per m³/day, while Dissolved Air Flotation (DAF) systems fall between $800–$2,000 per m³/day, depending on the specific application and contaminant load. These figures include the core treatment units, associated piping, pumps, and controls.
Regional cost variations also play a significant role. In China, overall wastewater treatment plant capital costs can be approximately 30% lower than in Western markets due to differences in labor, material sourcing, and manufacturing efficiencies. Conversely, projects in the European Union may see capital costs that are 20% higher, and in the United States, about 10% higher, primarily driven by stricter regulatory requirements, higher labor rates, and more expensive materials. For instance, California’s 2025 wastewater treatment cost benchmarks reflect higher overall capital expenses compared to other regions.
Beyond the core equipment, infrastructure costs for tertiary treatment are often higher. Tertiary systems frequently require additional space for specialized chemical storage, membrane cleaning facilities, and more sophisticated automation control rooms. While wetland assimilation is a low-cost and low-energy alternative to traditional tertiary wastewater treatment, conventional tertiary systems often demand a more compact, engineered footprint, which can increase land acquisition or development costs, particularly in urban or industrial areas.
Treatment Type / System
Capital Cost per m³/day Capacity (USD)
Typical Plant Size (m³/day)
Estimated Total Capital Cost (USD)
Secondary Treatment (Activated Sludge)
$500 – $1,200
500
$250,000 – $600,000
5,000
$2,500,000 – $6,000,000
Tertiary Treatment (MBR System)
$1,500 – $3,000
500
$750,000 – $1,500,000
5,000
$7,500,000 – $15,000,000
Tertiary Treatment (DAF System)
$800 – $2,000
500
$400,000 – $1,000,000
5,000
$4,000,000 – $10,000,000
Note: Costs are indicative for 2025 and can vary based on project specifics, site conditions, and procurement.
Operational Costs: Energy, Chemicals, and Labor
Operational and maintenance (O&M) costs represent a substantial portion of the total lifecycle expenditure for wastewater treatment plants, with energy consumption, chemical usage, and labor requirements being the primary drivers. While tertiary treatment often involves higher capital costs, its O&M profile can offer long-term economic advantages, especially when considering the holistic impact of compliance and resource recovery.
Energy consumption is a major O&M component. Secondary treatment systems, particularly those relying on aeration for biological processes, typically consume 0.3–0.6 kWh per cubic meter of treated wastewater. Tertiary treatment systems, especially MBRs with their continuous membrane filtration and aeration, tend to have higher energy demands, ranging from 0.5–0.9 kWh per m³. However, this increased energy cost is often offset by the superior effluent quality and potential for water reuse.
Chemical costs are significantly higher for tertiary treatment. These systems frequently require coagulants like Poly-Aluminum Chloride (PAC) or ferric chloride, which can add $0.05–$0.15 per m³ to operating expenses. Disinfectants such as chlorine dioxide (ClO₂) or UV treatment may also be necessary, adding another $0.02–$0.08 per m³. Zhongsheng Environmental’s PLC-controlled chemical dosing for precise tertiary treatment can optimize these expenditures, reducing chemical waste.
Labor requirements generally decrease with higher levels of automation in tertiary systems. A secondary treatment plant might require one operator per 1,000 m³/day capacity for routine monitoring and maintenance. In contrast, a modern tertiary facility, especially those incorporating advanced controls and remote monitoring, can operate with approximately 0.5 operators per 1,000 m³/day, leading to significant labor savings over the plant's lifespan.
Sludge disposal costs are another critical factor. While tertiary treatment processes may generate more concentrated sludge, some advanced methods can reduce the overall sludge volume by 30–50% compared to conventional secondary treatment, by improving dewatering characteristics or reducing organic content. This reduction directly lowers disposal costs, which typically range from $0.10–$0.30 per kilogram of dewatered sludge, as highlighted by Poland’s sludge dewatering cost benchmarks for tertiary treatment.
Maintenance expenses for tertiary equipment, such as membranes in MBR systems, involve higher replacement costs but typically come with longer lifespans (5–10 years for membranes) compared to some mechanical components in secondary treatment (which often have lifespans of 10–15 years for pumps and blowers). Regular maintenance schedules and proper operation are crucial for maximizing equipment longevity and minimizing unexpected repair costs.
Operational Cost Category
Secondary Treatment (USD/m³)
Tertiary Treatment (USD/m³)
Energy Consumption
$0.03 – $0.06 (0.3-0.6 kWh/m³)
$0.05 – $0.09 (0.5-0.9 kWh/m³)
Chemicals (Coagulants, Disinfectants)
Limited or None
$0.07 – $0.23
Labor
$0.02 – $0.05
$0.01 – $0.03 (due to automation)
Sludge Disposal
$0.04 – $0.08
$0.02 – $0.05 (reduced volume)
Maintenance & Parts
$0.01 – $0.03
$0.02 – $0.06 (e.g., membrane replacement)
Total Estimated O&M Cost
$0.10 – $0.22
$0.17 – $0.46
Note: Energy costs calculated at $0.10/kWh. Sludge disposal at $0.20/kg. Ranges are indicative for 2025.
ROI Calculator: When Does Tertiary Treatment Pay Off?
secondary vs tertiary treatment cost difference - ROI Calculator: When Does Tertiary Treatment Pay Off?
Calculating the Return on Investment (ROI) for an upgrade to tertiary wastewater treatment is essential for justifying capital expenditure, as the long-term operational savings and revenue generation can significantly offset higher upfront costs. The fundamental ROI formula for such an investment can be expressed as: (Annual Savings - Annual O&M Increase) / Capital Cost Increase. This calculation provides a tangible payback period, crucial for budgetary approvals.
The primary drivers for annual savings include:
Fines Avoided: Depending on the severity and frequency of non-compliance, fines can range from $50,000 to over $200,000 per year for industrial facilities.
Water Reuse Revenue/Savings: Treated effluent can be reused for industrial processes (e.g., cooling water, boiler feed, washdown) or irrigation, reducing reliance on municipal water supplies. This can generate savings or revenue of $0.50–$2.00 per m³, depending on local water tariffs.
Reduced Sludge Disposal Costs: As discussed, some tertiary processes can significantly reduce sludge volume, leading to annual savings in disposal fees.
For an illustrative example, consider a 1,000 m³/day industrial plant currently using secondary treatment and facing $100,000 in annual compliance fines. An upgrade to an MBR-based tertiary system might incur an additional capital cost of $1,000,000 (at $1,000/m³/day for MBR, above secondary). While annual O&M might increase by $50,000 (due to higher energy/chemical usage), the plant now avoids $100,000 in fines and generates $150,000/year from reusing 50% of its treated water (at $1.00/m³).
Annual Savings: $100,000 (fines) + $150,000 (water reuse) = $250,000
Annual O&M Increase: $50,000
Net Annual Benefit: $250,000 - $50,000 = $200,000
Payback Period: $1,000,000 (Capital Cost Increase) / $200,000 (Net Annual Benefit) = 5 years.
This example demonstrates a compelling 5-year payback period, making the tertiary upgrade a sound financial decision. For readers to model their own specific projects, Zhongsheng Environmental offers a downloadable Excel template [link to gated asset here] to input localized data for a precise ROI calculation.
Beyond the quantifiable financial benefits, tertiary treatment offers significant intangible advantages. These include enhanced regulatory compliance and reduced legal risks, improved Environmental, Social, and Governance (ESG) reporting for corporate responsibility, and future-proofing against increasingly stringent environmental standards. These benefits contribute to brand reputation and long-term business sustainability.
Parameter
Value (Example for 1,000 m³/day plant)
Additional Capital Cost for Tertiary Upgrade
$1,000,000
Annual Fines Avoided
$100,000
Annual Water Reuse Revenue (50% reuse @ $1.00/m³)
$150,000
Annual O&M Increase (Tertiary vs. Secondary)
$50,000
Net Annual Financial Benefit
$200,000
Calculated Payback Period
5 years
Choosing Between Secondary and Tertiary Treatment: A Decision Framework
Selecting the appropriate level of wastewater treatment, whether secondary or tertiary, requires a systematic decision framework that prioritizes effluent quality requirements, budget constraints, and available physical space. This framework moves beyond a simple cost comparison to address real-world operational and regulatory pressures.
The first step in the decision process is always to assess the required effluent quality. If discharge permits stipulate stringent limits for BOD (<10 mg/L), TSS (<5 mg/L), or include specific requirements for nutrient removal (TN <15 mg/L, TP <1 mg/L) or pathogen inactivation, then tertiary treatment is unequivocally necessary. If basic compliance with less demanding standards (BOD <30 mg/L, TSS <30 mg/L) is the sole objective, secondary treatment may suffice.
Next, consider the project budget. While tertiary treatment has higher upfront capital costs, the long-term ROI from avoided fines and water reuse must be factored in. For projects with limited initial capital but high potential for water reuse or significant non-compliance risks, tertiary treatment can be more economical in the long run. Space constraints also play a role; advanced tertiary systems like MBRs offer compact footprints, which is critical for urban industrial parks, whereas conventional secondary systems may require larger land areas.
Matching treatment levels to specific use-cases is crucial. Secondary treatment is ideal for rural municipal plants or industries discharging into large, assimilative water bodies where basic compliance is the primary concern. Tertiary treatment, however, is essential for industrial facilities aiming for water recycling, municipal plants discharging into sensitive environments (e.g., coastal areas, lakes), or those mandated by regional regulations, such as UAE’s tertiary treatment standards and cost drivers for industrial wastewater.
Hybrid options can also provide effective solutions, balancing cost and performance. For instance, a secondary treatment plant augmented with a DAF system can achieve partial tertiary treatment, significantly reducing TSS and some organic load without the full capital expenditure of an MBR or RO system. This approach can be a cost-effective alternative for specific effluent quality improvements.
Common mistakes in this decision process include overestimating operational and maintenance (O&M) savings without accounting for energy and chemical costs, underestimating the replacement costs and frequency for advanced components like membranes, or overlooking the critical need for skilled operators and automation to manage complex tertiary systems effectively. A thorough engineering assessment, considering both capital and comprehensive O&M costs over the project lifecycle, is paramount.
Frequently Asked Questions
secondary vs tertiary treatment cost difference - Frequently Asked Questions
Frequently asked questions regarding secondary and tertiary wastewater treatment costs often revolve around initial investment, long-term operational expenses, and the ultimate economic justification for advanced treatment. Understanding these common queries helps clarify misconceptions and supports informed decision-making.
Is tertiary treatment always more expensive than secondary treatment?
Not necessarily. While tertiary treatment typically has higher upfront capital costs (e.g., $0.40–$1.00/m³ capacity vs. $0.20–$0.50/m³ for secondary), the long-term economic benefits can lead to a lower total cost of ownership. These benefits include avoided regulatory fines, revenue generation from water reuse ($0.50–$2.00/m³), and reduced sludge disposal costs, which can offset increased O&M expenses over time.
What is the typical payback period for upgrading to tertiary treatment?
The payback period for a tertiary treatment upgrade can vary significantly but commonly ranges from 3 to 7 years. This depends on factors such as the scale of the plant, the severity of avoided fines, the value of reclaimed water, and the specific tertiary technology chosen. For a 1,000 m³/day plant, a net annual saving of $200,000 on an additional $1,000,000 capital investment would yield a 5-year payback.
How do regional regulations impact the cost difference?
Regional regulations profoundly influence treatment costs. Areas with strict discharge limits for nutrients (N, P), pathogens, or specific industrial pollutants (e.g., heavy metals, recalcitrant organics) necessitate tertiary treatment, driving up capital and O&M expenses. Conversely, regions with more lenient standards or greater assimilative capacity in receiving waters may allow for secondary treatment, resulting in lower costs.
Can a secondary treatment plant be upgraded to tertiary in phases?
Yes, many secondary treatment plants can be upgraded to tertiary treatment in a phased approach, which helps manage capital expenditure. Common phased upgrades include adding physical-chemical processes like DAF for enhanced solids removal, followed by membrane filtration or advanced oxidation for nutrient and pathogen removal. This modularity allows facilities to meet evolving compliance needs incrementally.
Our team of wastewater treatment engineers has over 15 years of experience designing and manufacturing DAF systems, MBR bioreactors, and packaged treatment plants for clients in 30+ countries worldwide.