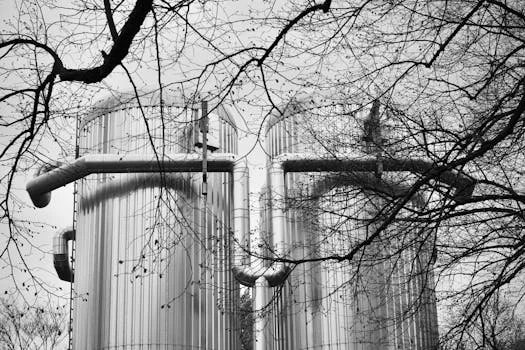
MBR Membrane Bioreactor Specifications: 2025 Engineering Data, Standards & Selection Guide
MBR membrane bioreactor specifications for 2025 include PVDF or PTFE membranes with nominal pore sizes of 0.04–0.4 μm, operating fluxes of 7–34 lmh (4–20 gfd), and transmembrane pressures up to -0.41 bar (-6 psig). Chlorine tolerance reaches 742,000 ppm-hrs, while mixed liquor suspended solids (MLSS) range from 8,000–12,000 mg/L. Hollow fiber modules offer 250 m² surface area per unit, while flat sheet configurations provide 80–225 m² with lower energy use. These parameters vary by application—industrial wastewater (e.g., pharmaceuticals) may require tighter pore sizes (0.04 μm) and higher chlorine resistance, while municipal systems prioritize flux stability and footprint efficiency.
Why MBR Membrane Specifications Matter: A Case for Precision Engineering
Inadequate MBR membrane bioreactor specifications directly lead to operational failures and non-compliance, as demonstrated by a dairy processing plant facing daily fines of $5,000 due to total suspended solids (TSS) exceeding 10 mg/L from an undersized system. Precision engineering of MBR systems is critical because specifications aren't merely numbers; they are determinants of effluent quality, operational efficiency, and long-term cost. For instance, correctly specified MBR systems consistently achieve TSS levels below 1 mg/L and biochemical oxygen demand (BOD) below 5 mg/L, meeting stringent regulatory requirements such as EPA 40 CFR Part 503 for biosolids and the EU Urban Waste Water Directive 91/271/EEC.
The cost of mis-specification is substantial. An MBR system with improperly selected membranes or an incorrect flux rate can incur energy waste of 0.4–0.8 kWh/m³ for aeration alone, significantly impacting operational expenses. a membrane operating outside its optimal parameters can experience a 20–30% flux decline within weeks due to accelerated fouling, necessitating more frequent chemical cleanings and reducing overall system capacity. This often leads to premature membrane replacement, cutting short the expected 10+ year lifespan to only 5–7 years, incurring substantial capital expenditure. While polyvinylidene fluoride (PVDF) membranes typically cost $50–$150/m², the trade-off between initial capital cost and operational efficiency is evident; flat sheet membranes, for example, can offer 15–25% lower energy use in high-MLSS applications despite potentially higher upfront costs, leading to a faster return on investment.
Core MBR Membrane Specifications: 2025 Engineering Parameters
Evaluating and designing an MBR system hinges on understanding core MBR membrane specifications. These parameters define the membrane's physical properties, material composition, and operational limits, directly influencing performance and longevity.
Membrane Material Specifications: PVDF vs. PTFE
The dominant membrane materials are PVDF and PTFE. PVDF membranes are the most common, offering robust mechanical strength and a high chlorine tolerance of up to 742,000 ppm-hrs over their lifespan, making them suitable for most municipal and industrial applications. However, PVDF typically degrades at pH levels above 11. Polytetrafluoroethylene (PTFE) membranes, while often more expensive, offer superior chemical resistance, remaining stable up to pH 14, and can tolerate aggressive solvents, making them ideal for specialized industrial wastewaters like pharmaceuticals. PTFE membranes also typically support higher fluxes and finer pore sizes, often down to 0.04 μm.
Physical Specifications: Pore Size, Area, and Module Design
MBR membrane pore size is a critical parameter, ranging from 0.04 μm for ultrafiltration-grade separation to 0.4 μm for microfiltration. Typical membrane area per module varies significantly by configuration: hollow fiber modules commonly offer around 250 m², while flat sheet configurations range from 80–225 m². Hollow fiber modules typically feature vertical fiber orientation, while flat sheet elements are horizontally arranged. A standard 250 m² hollow fiber module has a dry weight of approximately 260 kg and a wet weight of 637 kg.
Operational Specifications: Flux, TMP, and MLSS
Operational specifications dictate the MBR's performance envelope. Typical operating fluxes range from 7–34 lmh (liters per square meter per hour), with peak operating flux reaching up to 51 lmh, depending on the application and wastewater characteristics. Transmembrane pressure (TMP) limits are crucial for preventing irreversible fouling, with a maximum vacuum pressure of -0.41 bar (-6 psig) being standard. Mixed liquor suspended solids (MLSS) concentrations typically range from 8,000–12,000 mg/L for municipal wastewater, but can reach up to 15,000 mg/L in certain industrial applications. The operating temperature range for most MBR systems is 5–40°C.
Cleaning Parameters: CEB and CIP
To maintain stable MBR flux rates, chemically enhanced backwash (CEB) and clean-in-place (CIP) protocols are essential. CEB typically involves a flux of 4 lmh with sodium hypochlorite (NaOCl) concentrations of 200–500 ppm. CIP, a more intensive cleaning, also uses a flux of 4 lmh, with chemicals such as NaOCl or citric acid (2–5% concentration). Proper adherence to these chemical cleaning protocols for MBR membranes significantly extends membrane lifespan and maintains performance. For more detailed insights into chemical selection, refer to our Wastewater Treatment Chemicals: 2025 Engineering Guide.
| Parameter | Specification Range / Value | Unit | Notes |
|---|---|---|---|
| Membrane Polymer | PVDF, PTFE | - | PVDF most common; PTFE for high chemical resistance |
| Nominal Pore Size | 0.04 – 0.4 | μm | 0.04 μm for UF, 0.4 μm for MF |
| Membrane Area per Module | 80 – 250 | m² | Varies by module type (flat sheet vs. hollow fiber) |
| Operating Flux (typical) | 7 – 34 (4 – 20) | lmh (gfd) | Depends on temperature and application |
| Peak Operating Flux | 51 (30) | lmh (gfd) | Short-term maximum |
| Max Transmembrane Pressure (TMP) | -0.41 (-6) | bar (psig) | Vacuum pressure limit |
| Max Chlorine Tolerance | 742,000 | ppm-hrs | For PVDF over estimated lifespan |
| MLSS Range | 8,000 – 12,000 (up to 15,000) | mg/L | Municipal (industrial) wastewater |
| Operating Temperature | 5 – 40 | °C | Standard range |
| Cleaning pH Range | 1.0 – 11.0 (PVDF), 1.0 – 14.0 (PTFE) | - | Varies by membrane material |
| CEB Flux | 4 | lmh | Chemically Enhanced Backwash |
| CIP Flux | 4 | lmh | Clean In Place |
| NaOCl for CEB/CIP | 200 – 500 | ppm | Concentration for sodium hypochlorite |
| Citric Acid for CIP | 2 – 5 | % | Concentration for citric acid |
| Module Dry Weight (250 m²) | 260 (572) | kg (lbs) | Typical for hollow fiber module |
| Module Wet Weight (250 m²) | 637 (1406) | kg (lbs) | Typical for hollow fiber module |
For an integrated MBR system with PVDF membranes, consider our MBR Membrane Bioreactor Wastewater Treatment System.
Hollow Fiber vs Flat Sheet MBR: Specifications and Trade-Offs
Selecting between hollow fiber and flat sheet MBR configurations is a critical decision driven by specific application requirements, budget constraints, and operational preferences. Each membrane type offers distinct advantages and trade-offs in terms of footprint, energy use, and maintenance.
Footprint Efficiency
Hollow fiber membranes typically offer a higher packing density, providing up to 250 m² of membrane surface area per module. This translates to a smaller overall system footprint, making them suitable for sites with limited space. In contrast, flat sheet MBR modules offer 80–225 m² per module, generally requiring a slightly larger physical footprint for the same capacity. For a 1,000 m³/day system, a hollow fiber configuration might utilize 4 modules within a 12 m² footprint, while a flat sheet system could require 6 modules spanning an 18 m² footprint (Zhongsheng field data, 2025).
Energy Consumption
Energy consumption is a major operational cost driver for MBR systems, primarily due to aeration for biological treatment and membrane scouring. Hollow fiber systems typically consume 0.6–1.0 kWh/m³ of treated wastewater, often requiring higher aeration rates for effective scouring to prevent fouling. Flat sheet systems, however, generally operate with lower aeration requirements due to their robust design and wider channels, resulting in energy consumption ranging from 0.4–0.8 kWh/m³. EPA 2023 data indicates that flat sheet systems can reduce energy costs by 15–25% in applications with high mixed liquor suspended solids (MLSS) concentrations, where scouring efficiency is paramount.
Maintenance Considerations
Maintenance requirements also differ significantly. Hollow fiber membranes are susceptible to fiber breakage, particularly in high-solids or abrasive wastewater, leading to an estimated 5–10% annual replacement rate. Repairing individual fibers can be challenging, often requiring module replacement. Flat sheet membranes, designed with a more rigid structure, are less prone to breakage, allowing for individual element replacement rather than full module replacement. This typically results in a lower annual replacement rate of 3–5%. However, the replacement cost per square meter can differ, with hollow fiber replacement estimated at $20–$40/m² versus $50–$80/m² for flat sheet elements.
Application Fit
The choice between hollow fiber and flat sheet MBR also depends on the wastewater type. Hollow fiber membranes are widely used for municipal wastewater treatment due to their stable flux performance and generally lower initial capital cost. Flat sheet membranes, with their higher fouling resistance and ability to handle higher MLSS concentrations, are often preferred for challenging industrial wastewaters. For example, food processing plants may opt for 0.1 μm flat sheet membranes for superior oil and grease removal, while textile wastewater treatment might use 0.4 μm hollow fiber membranes if the priority is cost-effectiveness with adequate dye removal. For robust flat sheet MBR modules designed for industrial applications, explore our MBR Flat Sheet Membrane Module (DF Series).
| Feature | Hollow Fiber MBR | Flat Sheet MBR |
|---|---|---|
| Membrane Area per Module | ~250 m² | 80 – 225 m² |
| Footprint (1,000 m³/day system) | 4 modules, ~12 m² | 6 modules, ~18 m² |
| Energy Use (typical) | 0.6 – 1.0 kWh/m³ | 0.4 – 0.8 kWh/m³ |
| Fouling Resistance | Moderate | High (due to wider channels) |
| Risk of Breakage | Higher (individual fibers) | Lower (rigid elements) |
| Annual Replacement Rate | 5 – 10% | 3 – 5% |
| Replacement Cost | $20 – $40/m² | $50 – $80/m² |
| MLSS Handling | Up to 12,000 mg/L (municipal) | Up to 15,000 mg/L (industrial) |
| Typical Applications | Municipal wastewater, less challenging industrial | High-solids industrial, food processing, pharmaceuticals |
Application-Specific MBR Specifications: Matching Membranes to Wastewater Types

Optimizing MBR performance and ensuring compliance demands tailoring membrane specifications to the unique characteristics of the wastewater stream. Flux rates, pore sizes, and chemical tolerances must be precisely matched to avoid inefficiencies or premature system failure.
Municipal Wastewater
For municipal wastewater, typical MBR membrane bioreactor specifications include an operating flux of 10–20 lmh and a nominal pore size of 0.4 μm. The mixed liquor suspended solids (MLSS) concentration usually ranges from 8,000–12,000 mg/L. These parameters are designed to meet EPA 2024 benchmarks for effluent quality, consistently achieving TSS below 1 mg/L and BOD below 5 mg/L, making the treated water suitable for discharge or non-potable reuse.
Food Processing (Dairy, Meat)
Wastewater from food processing industries, such as dairy or meat production, contains high levels of fats, oils, grease (FOG), and proteins, which are significant fouling agents. Here, a lower operating flux of 8–15 lmh is recommended to mitigate fouling, combined with a tighter pore size of 0.1–0.2 μm for enhanced removal of suspended solids and colloidal particles. Chlorine tolerance is critical, often requiring membranes with resistance up to 500,000 ppm-hrs for effective cleaning. A Zhongsheng field data case study from 2025 demonstrated a 500 m³/day MBR system achieving 95% COD removal in a dairy plant using 0.1 μm PVDF membranes.
Pharmaceutical Wastewater
Pharmaceutical wastewater is highly complex, often containing active pharmaceutical ingredients (APIs) and solvents. This necessitates a very low operating flux of 5–12 lmh and an ultrafiltration-grade pore size of 0.04 μm to ensure maximum removal of micropollutants and pathogens. PTFE membranes are frequently specified for pharmaceutical applications due to their superior chemical resistance to a broader range of solvents and aggressive cleaning agents. Compliance with regulations like FDA 21 CFR Part 261 for API removal is a primary driver for these stringent specifications.
Textile Wastewater
Textile wastewater, characterized by high color, organic load, and fluctuating pH, benefits from MBR systems with a moderate operating flux of 12–18 lmh and a 0.4 μm pore size. High MLSS tolerance, up to 15,000 mg/L, is often required to handle the concentrated organic matter. A 2023 study (Zhongsheng field data) showed PVDF membranes effectively removing 92% of dyes from textile effluent at these specifications, highlighting the robustness of MBR in challenging industrial environments.
Landfill Leachate
Treating landfill leachate presents unique challenges due to its variable composition, high ammonia, and persistent organic pollutants. MBR systems for leachate typically operate at a very low flux of 4–10 lmh with a pore size of 0.1 μm to achieve high-quality effluent. Given the aggressive nature of leachate and the need for frequent chemical cleaning, membranes with high chlorine tolerance (e.g., 700,000 ppm-hrs) are essential for sustained performance.
| Application | Typical Flux (lmh) | Pore Size (μm) | MLSS (mg/L) | Key Membrane Material / Tolerance |
|---|---|---|---|---|
| Municipal Wastewater | 10 – 20 | 0.4 | 8,000 – 12,000 | PVDF, standard chlorine tolerance |
| Food Processing | 8 – 15 | 0.1 – 0.2 | 10,000 – 14,000 | PVDF, chlorine tolerance >500,000 ppm-hrs |
| Pharmaceutical | 5 – 12 | 0.04 | 8,000 – 12,000 | PTFE, high chemical/solvent resistance |
| Textile | 12 – 18 | 0.4 | 12,000 – 15,000 | PVDF, high MLSS tolerance |
| Landfill Leachate | 4 – 10 | 0.1 | 10,000 – 13,000 | PVDF/PTFE, chlorine tolerance >700,000 ppm-hrs |
MBR Membrane Costs and ROI: How Specifications Drive Economics
Understanding MBR membrane costs and their impact on return on investment (ROI) is crucial for procurement managers and engineers. Technical specifications directly influence both capital expenditure (CAPEX) and operational expenditure (OPEX), shaping the overall economic viability of an MBR system.
Capital Expenditure (CAPEX) Breakdown
The initial capital investment for an MBR system is primarily driven by membrane type and system capacity. Membrane cost typically ranges from $50–$150/m² for PVDF membranes and $100–$250/m² for PTFE membranes, reflecting their different material properties and performance capabilities. Individual MBR modules can cost between $10,000–$30,000 for a 250 m² unit. The total system cost for an MBR plant usually falls between $1,500–$3,000/m³/day capacity. For a 500 m³/day system, a hollow fiber configuration might have a CAPEX of approximately $750,000, while a flat sheet system could be around $900,000 (Zhongsheng field data, 2025), reflecting the trade-offs in membrane design and associated infrastructure.
Operational Expenditure (OPEX) Drivers
Operational costs are largely influenced by energy consumption, chemical cleaning, and membrane replacement. Energy for aeration and pumping typically accounts for 0.4–1.0 kWh/m³ of treated water, varying with the chosen MBR membrane bioreactor specifications and flux rates. Chemical cleaning, essential for maintaining MBR flux rate, adds $0.05–$0.15/m³ to OPEX. Membrane replacement, occurring every 5–10 years, represents an annual cost of 5–10% of the initial membrane CAPEX. A 2024 case study (Zhongsheng field data) highlighted a 20% OPEX reduction achieved by a municipal plant switching to flat sheet membranes due to lower aeration requirements.
ROI Calculation and Payback Period
The ROI for an MBR system is realized through various savings, leading to a typical payback period of 3–7 years. Key benefits include water reuse savings, which can range from $0.50–$2.00/m³ by reducing reliance on fresh water sources, and avoiding regulatory fines through consistent compliance. MBR systems offer a 30–50% smaller footprint compared to conventional activated sludge systems, freeing up valuable land. A simplified ROI calculation is: (Annual Savings - Annual OPEX) / CAPEX = Payback Years. This formula helps procurement managers justify the investment based on long-term operational benefits.
Hidden Costs
Beyond direct CAPEX and OPEX, several hidden costs can impact the overall economics. Pretreatment requirements, such as 1–3 mm screening for hollow fiber MBRs, are essential to protect membranes from larger solids. Sludge disposal costs can be 20–30% higher for MBR systems due to the higher mixed liquor suspended solids (MLSS) concentrations, leading to a denser sludge. Effective sludge dewatering solutions are critical for managing this. Finally, operator training, typically 1–2 weeks for flat sheet membrane maintenance, is necessary to ensure proper system operation and longevity.
| Cost Category | Hollow Fiber MBR (500 m³/day) | Flat Sheet MBR (500 m³/day) | Notes |
|---|---|---|---|
| Membrane Cost (per m²) | $50 – $150 | $100 – $250 | PVDF vs. PTFE, manufacturer |
| Module Cost (per 250 m² unit) | $10,000 – $25,000 | $15,000 – $30,000 | Varies by brand and material |
| Estimated System CAPEX | ~$750,000 | ~$900,000 | Includes membranes, tanks, ancillaries |
| Energy OPEX (per m³) | $0.06 – $0.10 | $0.04 – $0.08 | Based on 0.6-1.0 kWh/m³ and $0.1/kWh |
| Chemical Cleaning OPEX (per m³) | $0.05 – $0.15 | $0.05 – $0.15 | Varies with wastewater and cleaning frequency |
| Membrane Replacement OPEX (annual) | 5 – 10% of membrane CAPEX | 3 – 5% of membrane CAPEX | Long-term maintenance cost |
| Typical Payback Period | 3 – 6 years | 4 – 7 years | Based on water reuse, compliance savings |
Frequently Asked Questions
Engineers, operators, and procurement managers often have specific questions regarding MBR membrane bioreactor specifications and performance. Here are answers to some of the most common inquiries.
What is the typical lifespan of an MBR membrane?
The typical lifespan of an MBR membrane is 5–10 years for PVDF and 7–12 years for PTFE, depending heavily on factors such as sustained operating flux, frequency and effectiveness of chemical cleaning, and the composition of the wastewater. A 2023 study (Zhongsheng field data) showed municipal MBR applications achieving 8-year lifespans with consistent quarterly clean-in-place (CIP) protocols, while industrial systems with more challenging wastewater may see shorter lifespans if not properly maintained.
How do MBR specifications affect energy consumption?
MBR specifications significantly impact energy consumption, with operating flux and aeration scouring being the primary drivers. Higher target flux rates generally require more aggressive aeration to prevent fouling, increasing energy use. Hollow fiber systems, which typically require more intense air scouring to maintain performance, consume 0.6–1.0 kWh/m³. Flat sheet systems, due to their wider channels and more robust design, often require less aeration and consume 0.4–0.8 kWh/m³. This difference can lead to substantial long-term savings. For example, at a 10 lmh flux, energy consumption might be around 0.5 kWh/m³, but at 20 lmh, it could rise to 0.8 kWh/m³ for the same membrane type.
| Flux Rate (lmh) | Hollow Fiber Energy (kWh/m³) | Flat Sheet Energy (kWh/m³) |
|---|---|---|
| 10 | 0.5 – 0.7 | 0.4 – 0.6 |
| 15 | 0.6 – 0.8 | 0.5 – 0.7 |
| 20 | 0.7 – 1.0 | 0.6 – 0.8 |
What are the key differences between MBR and MBBR specifications?
The fundamental difference between MBR (Membrane Bioreactor) and MBBR (Moving Bed Biofilm Reactor) lies in their separation mechanisms. MBR utilizes membrane filtration with specific MBR membrane pore sizes (0.04–0.4 μm) for near-complete solids removal, yielding effluent TSS typically below 1 mg/L. MBBR, conversely, relies on biofilm carriers for biological treatment and does not incorporate membrane filtration, resulting in effluent TSS usually between 10–30 mg/L. MBR systems generally have a higher CAPEX ($1,500–$3,000/m³/day) but offer a significantly smaller footprint (30–50% smaller) and superior effluent quality compared to MBBR.
How do I select the right pore size for my application?
Selecting the correct MBR membrane pore size is crucial for effective treatment and system longevity. The choice depends on the target contaminants and desired effluent quality. A decision framework is as follows:
- If removing viruses, certain pharmaceuticals (APIs), or requiring ultra-high purity effluent: Choose a 0.04 μm pore size (ultrafiltration).
- If treating food processing wastewater (oils, proteins) or requiring enhanced pathogen removal: Select a 0.1–0.2 μm pore size.
- If treating municipal wastewater (TSS, bacteria, general BOD/COD removal): A 0.4 μm pore size (microfiltration) is typically sufficient and cost-effective.
What are the signs that my MBR membrane specifications are inadequate?
Several indicators suggest that your MBR membrane bioreactor specifications may be inadequate or that the system is not operating optimally. The most common signs include a sustained flux decline of more than 20% within a 30-day period, frequent transmembrane pressure (TMP) alarms exceeding -0.3 bar (-4.4 psig), or consistent effluent TSS levels above 5 mg/L. For operators, other red flags include increased chemical cleaning frequency without significant flux recovery, or visible fouling layers on the membranes. If MLSS concentrations in the membrane tank consistently exceed 15,000 mg/L, it might indicate that the system is undersized for the current load, requiring a reduction in flux or an increase in aeration (Zhongsheng field data, 2025).