Municipal sewage treatment plant costs South Africa municipalities still use for planning run from R5 million for a 1 MLD train to R50 million for a 20 MLD works. The 2025 Green Drop Report audited 848 wastewater systems for the 2023/24 municipal year. Critical systems were 396, equal to 47%. About 61% scored below the minimum level when poor and critical results are combined.
South Africa's municipal sewage treatment plants face a documented performance crisis. Earlier reporting often cited about 955 plants, with roughly 60% in a poor-to-critical condition and an estimated R332 billion infrastructure backlog. Department of Water and Sanitation discharge rules still cite General Authorisation values such as chemical oxygen demand below 75 mg/L and total suspended solids below 25 mg/L. Towns facing high fats, oils and grease, intermittent power, and skill gaps still weigh containerized MBR, DAF pre-treatment, and conventional upgrades in the R5 million to R50 million CAPEX band for 1–20 MLD plants.
Municipal sewage treatment plants: 2025 status and backlog
Municipal sewage works in South Africa commonly cost R5 million to R50 million for 1–20 MLD plants. General discharge limits are 75 mg/L COD and 25 mg/L suspended solids. The 2025 Green Drop cycle rated 396 of 848 systems critical. Buyers should fix the discharge instrument before choosing MBR, DAF, or conventional civils.
South Africa audited 848 municipal wastewater systems in the 2025 Green Drop cycle for the 2023/24 municipal year. Critical systems rose to 396, or 47%. About 61% scored below the minimum level when poor and critical categories are combined. Earlier guidance used about 955 plants and a 60% poor-to-critical share against the same R332 billion backlog planning figure.
According to DWS (31 October 2018), about 56% of the over 1,150 wastewater treatment works were poor or critical and needed rehabilitation. That count is from Volume 1 of the National Water and Sanitation Master Plan. It is wider than the 848 systems in the 2025 audit. The same volume states that 144 municipalities are water services authorities.
At least 33% of those municipalities were regarded as dysfunctional, and more than 50% had no or very limited technical staff.
Sanitation access in that 2018 plan was around 80% nationally, and South Africa was 65% urbanised. The plan cites a National Development Plan estimate of 10% urban population growth every two decades. Only 14 systems achieved Green Drop certification at scores of 90% or above, down from 22 in the prior full cycle. The estimated R332 billion infrastructure backlog remains the planning figure cited for provincial capital gaps.
Gauteng, KwaZulu-Natal, and the Eastern Cape still carry the largest reported shares of that backlog.
On plants we review in fast-growing towns, the inlet already sits near 120% of the original design load before the first summer storm. Common operational failures include that hydraulic overload after rapid urban growth. About 40% of plants lack essential operations and maintenance (O&M) contracts, which accelerates deferred maintenance. Intermittent power remains a process risk.
Rural plants have reported average outages near 12 hours per week, from Eskom 2024 reporting cited in prior sector reviews. That pattern interrupts aeration, disinfection, and sludge handling. Cumulative public-health pressure is severe. An estimated 3.5 million people face exposure pathways from untreated or poorly treated sewage, as cited from GreenCape 2023.
About 18% of surface water bodies have been reported non-compliant with SANS 241 drinking-water standards, from DWS 2024 reporting. Targeted upgrades, not blanket rebuilds, are the practical path for most Water Services Authorities.
| Province | Estimated Infrastructure Backlog (R billions) | Number of Plants Affected (Estimated) |
|---|---|---|
| Gauteng | R85B | 20+ |
| KwaZulu-Natal | R62B | 15+ |
| Eastern Cape | R58B | 10+ |
| Other Provinces | R127B | ~50+ |
| Total South Africa | R332B | ~570 (60% of 955) |
What are DWS General Authorisation effluent limits?
DWS General Authorisation discharge limits in Government Notice 665, Gazette 36820 of 6 September 2013, set chemical oxygen demand at 75 mg/L and suspended solids at 25 mg/L on the General Limit in Table 2.1. Earlier notes in this guide called those General Limit Values Table 3.2 and set ammonia as nitrogen below 3 mg/L. The gazette discharge General Limit for ammonia as nitrogen is 6 mg/L, and the Special Limit is 2 mg/L. The 3 mg/L ammonia figure is the irrigation limit in Table 1.1 for up to 2,000 m³/d, not the discharge general limit.
Faecal coliforms on the discharge General Limit do not exceed 1,000 per 100 mL, and pH stays between 5.5 and 9.5. These values remain the baseline many domestic and industrial discharges use, up to 2,000 m³/d, where a water-use licence is not required. Special Limits apply to listed water resources and are tighter, for example COD at 30 mg/L and suspended solids at 10 mg/L. The gazette also sets Special Limit pH at 5.5–7.5 and Special Limit faecal coliforms at 0 per 100 mL.
Both COD entries are printed with note (i), so a tender should read that note before the number is frozen.
A general discharge must not change the natural ambient temperature of the receiving water by more than 3 degrees Celsius. On a listed water resource the cap is 2 degrees Celsius. Soap, oil or grease does not exceed 2.5 mg/L on the General Limit and is 0 mg/L on the Special Limit. Ortho-phosphate as phosphorus does not exceed 10 mg/L on the General Limit, with a Special Limit of 1 mg/L as a median and 2.5 mg/L as a maximum.
Electrical conductivity on the General Limit is 70 mS/m above intake, to a maximum of 150 mS/m. The authorisation does not cover complex industrial wastewater, sea outfalls, aquifers, other groundwater, closed drainage systems, or a direct discharge into an off-channel dam.
Files we check still print ammonia below 3 mg/L, then miss a listed river that needs 2 mg/L. Notice 665 states a five-year term from 6 September 2013 unless it is amended, extended by a later gazette, replaced, or the user is told in writing to apply for a licence. Confirm the live instrument with DWS before ammonia or phosphate is frozen in a specification. SANS 241:2015 governs drinking-water quality, not wastewater effluent.
The 2018 master plan also records that the South African Bureau of Standards sets drinking-water standards, including SANS 241. Reuse or potable schemes must meet SANS 241 separately from General Authorisation discharge compliance.
Beyond liquid effluent, the National Environmental Management Act frames sludge classification and disposal. Sludge is commonly managed as Class A where pathogen criteria allow broader beneficial use, or Class B where disposal is more restricted and often landfill-oriented. Pathogen limits such as less than 1,000 MPN/g for Salmonella guide end-use decisions. Notice 665 points sludge disposal to the Water Research Commission sludge guidelines, Volumes 1 to 5.
The report numbers are TT 261/06, TT 262/06, TT 349/09, TT 350/09, and TT 351/09. Quantity is metered weekly, and domestic effluent quality is checked monthly by a grab sample.
An incident that may harm the resource must be reported within 24 hours. Analysis is tied to a SANAS laboratory accredited to SANS 17025:2005, or to an accepted proficiency route where no accredited lab is within reach.
Enforcement pressure is real. Sector reviews have cited average fines near R2.3 million per violation, from GreenCape 2023 reporting, and non-compliance notices at roughly 18% of plants in 2024. Green Drop results show only 14 certified systems in the 2025 cycle, confirming that certification remains rare. Typical compliance gaps include missing online sensors, weak sludge control, and inconsistent sampling.
Overloaded hydraulics, missing O&M contracts, power interruptions, and industrial shock loads drive most failures.
For local context on Gauteng treatment practice, including how is wastewater treated in midrand south africa, regional guides help procurement teams benchmark neighbour municipalities before issuing tenders.
Industrial contributors inside a municipal catchment are scored on a different permit track, set out in Industrial Waste Discharge Permit South Africa: 2026 Limits. Keep that industrial sheet separate from the municipal General Authorisation numbers above.
What inlet loads should a design brief record?
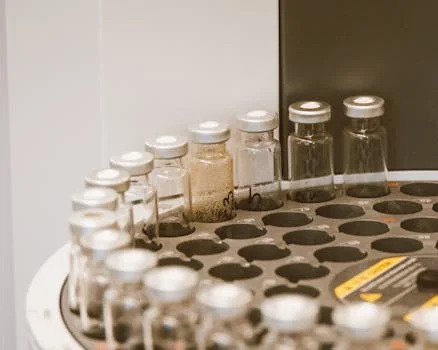
South African municipal wastewater typically shows COD of 500–1,200 mg/L and TSS of 300–800 mg/L at the plant inlet under dry-weather sampling programmes. FOG often sits at 100–300 mg/L and ammonia at 30–60 mg/L, from DWS 2024 benchmarks cited in sector practice notes. Those loads stress primary and biological stages. About 80% of existing plants have been reported operating at 120–150% of design load, as reported by SABC News.
Rainy-season peaks can reach three times dry-weather flow in parts of Gauteng. Roughly 40% of municipal plants receive industrial effluent, from textile dyes in Durban to abattoir organics in Cape Town. DAF or equalization is therefore often required upstream of biology. Power reliability remains a design constraint.
About 60% of plants have reported eight or more outage hours per week, from Eskom 2024 reporting. That pattern favors low-energy membranes, standby generation, and simpler operator routines. Design briefs should also record the share of unsewered informal settlement flows, often near 30% of inlet volume in stressed catchments. Those streams raise TSS and pathogen peaks and can defeat clarifiers sized only for formal sewer networks.
| Parameter | Typical Range (mg/L) | Specific Challenges in SA |
|---|---|---|
| Chemical Oxygen Demand (COD) | 500 – 1,200 | High organic load, requires robust biological treatment |
| Total Suspended Solids (TSS) | 300 – 800 | Can lead to clarifier overloading, high sludge volume |
| Fats, Oils, and Grease (FOG) | 100 – 300 | Causes blockages, foaming, and reduced oxygen transfer; requires effective pre-treatment |
| Ammonia (as N) | 30 – 60 | Requires effective nitrification for DWS compliance |
| Peak Flow (Rainy Season) | 3x Dry Weather Flow | Hydraulic overloading, bypass events |
Treatment technology comparison: MBR vs DAF vs conventional
Membrane bioreactor (MBR), dissolved air flotation (DAF), and conventional activated sludge remain the three options South African municipalities compare most often. FOG load, power reliability, and operator skill usually decide the shortlist. MBR packages such as containerized MBR systems for municipal sewage and modular low-energy MBR membranes for municipal reuse applications typically deliver below 10 mg/L TSS and below 30 mg/L COD. Pathogen removal commonly exceeds 99% under stable operation.
Footprint is often about 60% smaller than a conventional works of similar capacity. That suits constrained urban sites and irrigation or cooling-tower reuse.
On high-FOG sites we size, flotation goes in before anyone debates membranes. CAPEX for 1–10 MLD MBR plants commonly ranges from R12 million to R45 million at 2025 benchmarks. OPEX often lands near R1.20–R2.00/m³ when membrane replacement every 5–7 years is included.
Published comparisons that carry the label mbr wastewater treatment systems in south africa: 2026 engineering guide with costs, compliance & roi still need a local check. Test them against outage hours and Class B haulage near R1,200 per ton.
DAF is a pre-treatment step, not a full secondary process. DAF pre-treatment for high-FOG municipal wastewater can remove up to 90% FOG and cut downstream biological load by about 40–60% when coagulant and flocculant dosing is controlled. CAPEX for 1–20 MLD DAF trains typically sits between R2 million and R15 million, with pre-treatment OPEX near R0.20–R0.50/m³. Conventional activated sludge plus clarifiers still fit larger rural sites.
CAPEX for 1–20 MLD often ranges from R5 million to R30 million. OPEX can run about 30% higher than MBR once sludge haulage near R1,200 per ton for Class B cake is counted. Conventional effluent often lands at 30–50 mg/L TSS and 75–120 mg/L COD, from DWS 2024 programme data. Tertiary polishing is therefore frequently needed for reuse or tight licences.
Hybrid trains such as DAF plus MBR, or activated sludge plus tertiary filters, are common where industrial FOG or reuse targets dominate. Parallel lessons from overseas municipal wastewater treatment programmes show the same FOG-first, biology-second sequencing under mixed industrial loads.
| Technology | Key Advantage | Key Disadvantage | Typical CAPEX (R) (1-10 MLD) | Typical OPEX (R/m³) | Effluent Quality (TSS/COD) | Suitability for SA Conditions |
|---|---|---|---|---|---|---|
| MBR (Membrane Bioreactor) | Superior effluent quality, compact footprint, low sludge production | Higher initial CAPEX, membrane fouling risk, skilled O&M | R12M – R45M | R1.20 – R2.00 | < 10 mg/L TSS, < 30 mg/L COD | Urban areas, water reuse, high compliance needs, limited space |
| DAF (Dissolved Air Flotation) | Highly effective FOG/TSS pre-treatment, protects downstream processes | Requires chemical dosing, generates chemical sludge, not a standalone solution | R2M – R15M | R0.20 – R0.50 (pre-treatment) | Pre-treatment only (90% FOG removal) | Industrial influent, high FOG loads, upgrading existing plants |
| Conventional (Activated Sludge + Clarifier) | Familiar technology, lower initial CAPEX (for larger scales) | Larger footprint, moderate effluent quality, higher sludge production/disposal costs | R5M – R30M | R0.80 – R1.50 | 30-50 mg/L TSS, 75-120 mg/L COD | Rural areas, where land is abundant, where compliance is less stringent (or with tertiary upgrades) |
Municipal Sewage Treatment Plant Costs South Africa
CAPEX for new South African municipal works typically ranges from R5 million for a 1 MLD containerized MBR train to R50 million for a 20 MLD conventional plant with tertiary filtration. Those bands reflect 2025 tender benchmarks. A 1 MLD containerized MBR usually falls between R5 million and R15 million with short site programmes. For 1–5 MLD towns we price, the figure usually lands at the lower end of that R5 million to R15 million band when civils stay light.
Larger 5–20 MLD conventional-plus-tertiary schemes often require R20 million to R50 million once civil works and disinfection are included.
Buyers comparing absolute spend with other markets can review a detailed municipal wastewater treatment plant cost breakdown to separate local civil and labour effects from process equipment pricing.
Upgrade packages are usually cheaper than full rebuilds when hydraulics can be recovered. DAF pre-treatment for high FOG commonly costs R2 million to R10 million. An MBR retrofit for tighter effluent often sits between R5 million and R20 million. SCADA and PLC automation upgrades typically need R1 million to R5 million and cut response time during power or load shocks.
OPEX for conventional plants averages R0.80–R1.50/m³. MBR systems typically run R1.20–R2.00/m³ including membrane replacement every 5–7 years. PPP BOOT contracts of about 20 years, as seen in eThekwini in 2023, have used tariffs near R2.50–R4.00/m³. Funding channels cited in sector planning include DWS grants near R5 billion per year, GreenCape incentives such as a 20% CAPEX rebate for energy-efficient packages, and multilateral loan envelopes discussed for 2025–2030 programmes.
What do the 2018 planning rates imply?
Action 1.3.12 in the Master Plan Volume 3 Schedule of Actions (31 October 2018) lists 679 wastewater works in the national turnaround baseline. Gauteng is shown at 72 works, KwaZulu-Natal at 188, and the Eastern Cape at 49. The other rows are Free State 102, Limpopo 100, Mpumalanga 61, North West 33, Northern Cape 43, and Western Cape 31. Those counts are not the same base as the backlog table, which estimates plants affected rather than every works.
The present-value cost on that action is R6,854 million in 2018 rands, VAT exclusive. The same rows note R3.5 million per Ml to implement and R1 million per Ml to maintain. Volume 3 defines Ml/day as 1,000,000 litres per day, so 1 Ml/day equals 1 MLD. Treat that rate as a 2018 planning figure, not a replacement for the R5 million to R50 million tender bands.
Action 1.4.1 in the same schedule still recorded Green Drop as last published in 2014. It priced annual Blue Drop and Green Drop reporting near R29 million nationally, with a note of about R200,000 for each Water Services Authority. The 2025 cycle is later than that 2014 baseline.
| Project Type | Capacity (MLD) | Typical CAPEX Range (R) | Typical OPEX Range (R/m³) | Key Considerations |
|---|---|---|---|---|
| New Build (Containerized MBR) | 1 – 5 | R5M – R15M | R1.50 – R2.50 | Rapid deployment, compact footprint, high effluent quality |
| New Build (Conventional + Tertiary) | 5 – 20 | R20M – R50M | R0.80 – R1.50 | Larger footprint, established technology, often requires land |
| Upgrade (DAF Pre-treatment) | Existing plant | R2M – R10M | Added to base OPEX | Effective for FOG/TSS removal, protects downstream processes |
| Upgrade (MBR Retrofit) | Existing plant | R5M – R20M | R1.20 – R2.00 | Enhances effluent quality, reduces footprint, extends plant life |
| Upgrade (Automation/SCADA) | Existing plant | R1M – R5M | Reduced O&M costs | Improved control, efficiency, and compliance monitoring |
Which companies build large municipal plants?
Companies building large municipal plants in South Africa usually work under PPP, turnkey EPC, or modular supply models rather than as a single public-works crew. PPP BOOT structures suit schemes above about 20 MLD with 20-year operating transfers, off-balance-sheet funding, and private O&M. Negotiations are long, and tariff disputes have occurred, including in eThekwini in 2023. Turnkey EPC fits 5–20 MLD fixed-scope plants with single-point accountability and typical construction windows of 12–18 months.
Post-handover O&M support can be thin under pure EPC awards.
Modular containerized trains fit 1–5 MLD sites, emergency upgrades, and remote towns. Deployment often lands in 6–12 months, with CAPEX near R5 million to R15 million and OPEX of about R1.50–R2.50/m³. A label sold as the best city sewage system plan is still only a capacity rule. Use PPP above 20 MLD, turnkey between 5 and 20 MLD, and modular below 5 MLD or for rapid relief works.
Authorities we support lose more calendar time in pre-qualification than in the process choice.
Tendering commonly runs through DWS pre-qualification for about 6 months, an RFP for about 3 months, and award for about 3 months. Local-content rules under the Department of Trade and Industry framework typically require about 20% local content. Foreign OEMs therefore need South African fabrication, spares, and training partners. Bid evaluations should weight lifecycle OPEX and compliance risk equal to CAPEX, especially where Green Drop critical scores already trigger regulatory scrutiny.
Which procurement model fits the flow?
A simple capacity rule still holds for most Water Services Authorities. Use PPP above 20 MLD, turnkey between 5 and 20 MLD, and modular below 5 MLD or for rapid relief works. Match the model to operator skill as well as to flow. A 20-year PPP only pays where the tariff can carry private O&M.
A 12–18 month EPC suits a fixed 5–20 MLD scope. A 6–12 month modular train suits emergency relief under 5 MLD.
| Procurement Model | Best For (Capacity/Scenario) | Advantages | Disadvantages | Typical Project Duration |
|---|---|---|---|---|
| PPP (Public-Private Partnership) | >20 MLD, long-term operation, risk transfer | Off-balance-sheet funding, private sector expertise, long-term O&M | Complex negotiations, potential tariff disputes, long lead times | 20+ years (contract) |
| Turnkey (EPC) | 5–20 MLD, fixed scope, single accountability | Single point of contact, faster delivery, guaranteed performance | Higher CAPEX, limited post-commissioning O&M support | 12–18 months (construction) |
| Modular (Containerized) | <5 MLD, remote areas, emergency upgrades, scalability | Rapid deployment, lower CAPEX, flexible, easy relocation | Limited capacity per unit, potentially higher OPEX/m³, perception of temporary solution | 6–12 months (deployment) |
Supplier checklist for South African municipal sewage tenders
Procurement teams should score suppliers against DWS registration, NEMA sludge competence, ISO 9001 and ISO 14001, and BBBEE Level 1–4 status. Proven ability to meet General Authorisation effluent limits under South African influent and power conditions is equally essential. Request South African case studies that show high-FOG, intermittent-power, and mixed industrial loads, then verify references with municipal engineers. Confirm a 24/7 local service desk, spare-parts stock in Johannesburg or Cape Town, and operator training that matches municipal skill levels.
Ask for five-year financial statements and professional indemnity cover of at least R50 million. Prefer packages that demonstrate energy use below about 0.6 kWh/m³ for MBR duties, clear reuse options, and sludge-to-energy pathways where digester gas is viable. Tender packs we open often skip the runtime needed for an 8-hour outage, then fight about membranes after award.
Selection checklist before award:
- DWS registration and NEMA-aligned sludge handling plan
- ISO 9001 and ISO 14001 certificates still in force
- BBBEE Level 1–4 evidence matching tender rules
- Verified South African references for similar MLD and FOG profiles
- Local spares, 24/7 call-out, and operator training syllabus
- Guaranteed effluent against GA Table 3.2 limits at stated temperature and load
- Energy, membrane life, and Class A/B sludge disposal cost model
Red flags include no local office, no South African references, missing BBBEE proof, or no DWS registration trail. Ask bidders to state membrane warranty years, chemical dose rates at the stated FOG range, and generator runtime needed for an 8-hour outage. Read the live gazette table, which is Table 2.1 in Notice 665, beside any bid that still cites Table 3.2. For flow, COD, FOG, and power data packs, write the values down before the process train is frozen.
Who this is for: municipal engineers, EPC contractors, and procurement managers sizing 1–20 MLD upgrades under Green Drop pressure. Who should look elsewhere: households seeking septic advice, or industrial sites that need only a trade-effluent pre-treatment unit without municipal compliance scope. Next step: lock influent COD, TSS, and FOG, peak-to-average flow, power reliability, and the applicable General Authorisation versus licence limits before choosing MBR, DAF, or conventional civils. Municipalities can request a process and cost check once those figures sit on one sheet.
Frequently Asked Questions
How many municipal sewage treatment plants are in South Africa?
The 2025 Green Drop Report audited 848 municipal wastewater treatment systems for the 2023/24 year across 144 Water Services Authorities. Earlier public figures often cited about 955 plants nationwide. Of the 848 audited systems, 396 (47%) were critical, and roughly 61% scored below the minimum when poor and critical categories are combined. A 2018 DWS master plan had counted over 1,150 works on a wider base.
What is the problem with sewage in South Africa?
Sewage failures come from aging works, overload near 120% of design capacity at many sites, missing O&M contracts at about 40% of plants, and power cuts that stop aeration. Rural reviews have cited outages near 12 hours per week. These failures push poorly treated sewage into rivers and expose an estimated 3.5 million people. Green Drop 2025 shows critical systems at 47%, with only 14 systems certified.
Does South Africa have a sewer system?
Yes. Urban and peri-urban areas generally have sewer networks that feed municipal works, but many households still use pit latrines. Older cities, including Johannesburg, still run combined or overloaded sewers that spill in heavy rain. Non-sewered sanitation is now recognised in Green Drop planning where conventional sewers are not feasible. Design briefs should record unsewered flows, often near 30% of inlet volume in stressed catchments.
What is the most cost-effective sewage treatment technology for South African municipalities?
For plants under 5 MLD, containerized MBR systems often balance capital and compliance at about R5 million to R15 million and R1.20–R2.00/m³, with TSS below 10 mg/L. Above 5 MLD, DAF for fats plus conventional activated sludge can fit at roughly R20 million to R50 million when land is available. The 2018 schedule used R3.5 million per megalitre to implement, which is a planning rate, not a 2025 tender. Final choice depends on FOG, reuse, power, and operator skill.
What effluent limits must South African municipal plants meet?
Discharge to a water resource under the General Limit must stay at or below 75 mg/L COD and 25 mg/L suspended solids. Ammonia as nitrogen is 6 mg/L on that General Limit and 2 mg/L on the Special Limit for listed rivers. Earlier notes used 3 mg/L, which matches the irrigation limit for up to 2,000 m³/d, not the discharge table. Faecal coliforms stay below 1,000 per 100 mL, and pH stays between 5.5 and 9.5.