Why Food Processing Wastewater Needs Underground Treatment Systems
Food processing wastewater overloads systems built for domestic sewage. Domestic sewage typically runs 200–500 mg/L Chemical Oxygen Demand (COD). Food processing effluent often reaches 1,500–5,000 mg/L COD at peak, with fats, oils, and grease (FOG) at 500–1,500 mg/L. Common local POTW thresholds sit near 300 mg/L BOD and 100 mg/L TSS; plants above those levels often pay sewer surcharges of $0.50–$2.00 per m³. EPA has not set categorical numerical BOD/TSS pretreatment limits for food processors—40 CFR Part 403 general standards and local sewer limits apply instead (EPA Multimedia Environmental Compliance Guide for Food Processors, 1999). A dairy plant at 30 m³/h can accrue tens of thousands of dollars a year in surcharges if it discharges untreated. Underground installations cut footprint by 60–80% versus above-ground basins, freeing production and storage space. Most plants we size in this segment use packaged underground sewage treatment systems for food processing when the site and the discharge limits are both tight.
Influent Parameters by Food Processing Sub-Sector
Effective treatment starts with the influent. Dairy, meat, beverage, and snack sub-sectors each carry distinct COD, BOD, FOG, TSS, and pH profiles that drive pretreatment and biological reactor selection:
| Food Processing Sub-Sector | Typical COD (mg/L) | Typical BOD (mg/L) | Typical FOG (mg/L) | Typical TSS (mg/L) | Typical pH Range |
|---|---|---|---|---|---|
| Dairy | 3,000–5,000 | 1,500–3,000 | 600–1,200 | 200–400 | 4.5–6.5 |
| Meat Processing | 2,000–4,000 | 1,000–2,500 | 400–800 | 300–600 | 6.0–8.0 |
| Beverage Production | 1,000–3,000 | 500–1,500 | 100–300 | 50–150 | 3.5–11.0 |
| Snack Foods | 2,500–4,500 | 1,200–2,800 | 500–1,000 | 150–300 | 5.0–7.5 |
Dairy wastewater carries high lactose and fat, which push COD and FOG up while driving pH acidic; neutralization usually precedes biological treatment. Meat processing effluent is rich in proteins and blood, so BOD and TSS climb and screening plus anaerobic pretreatment pay off. Beverage plants swing pH widely from acid and caustic cleaning cycles, so equalization tanks and pH correction are standard. Snack lines produce starch- and oil-laden streams where a DAF system for FOG removal protects the downstream biology from grease shock loads.
Underground System Technologies Compared: A/O vs. MBR vs. SBR
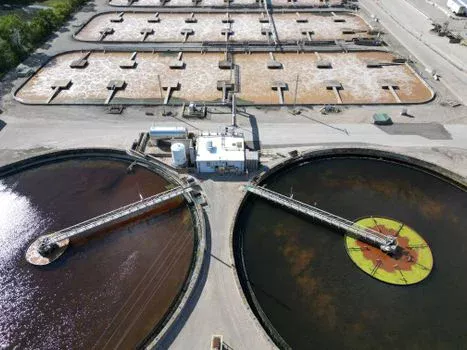
Choosing between A/O, MBR, and SBR for underground installation hinges on influent strength, reuse intent, footprint, and lifecycle cost. The table below compares the three at typical food-processing conditions:
| Technology | Typical COD Removal Efficiency | Footprint Reduction (vs. Above-ground) | Energy Use (kWh/m³) | CapEx ($/m³) | OPEX ($/m³/yr) | Maintenance Complexity | Best Suited For |
|---|---|---|---|---|---|---|---|
| A/O (Anoxic/Oxic) | 92–97% | 60–70% | 0.3–0.6 | 150–250 | 5–15 | Low (automated) | Moderate loads (1,500–3,000 mg/L COD) |
| MBR (Membrane Bioreactor) | >98% (near-reuse quality) | 70–80% | 0.5–0.8 | 300–400 | 15–30 (includes membrane maintenance) | Moderate (membrane cleaning) | High loads (3,000–5,000 mg/L COD), water reuse |
| SBR (Sequencing Batch Reactor) | 90–95% | 20–30% (requires larger tank volume) | 0.4–0.7 | 200–300 | 8–20 | Moderate (batch control) | Variable loads, larger sites |
A/O systems, including the WSZ series underground A/O system for food processing, run fully automated and fit moderate-strength streams where the operator wants low labor. MBR units, such as the MBR system for high-load or reuse applications, add a physical membrane barrier that delivers near-reuse effluent for plants facing strict limits or chasing water reclamation credits. SBR remains flexible on variable loads but needs more tank volume and is more vulnerable to FOG fouling, so it shows up less often in demanding food lines.
How to Size Your Underground System
Underground system capacity is set by daily wastewater volume, plant operating hours, and a safety factor for peak loads. The working formula is:
Required Capacity (m³/h) = (Daily Wastewater Volume (m³/day) / Operating Hours (h/day)) × Safety Factor (1.2–1.5)
A safety factor of 1.2 to 1.5 covers peak production runs, seasonal swings, and modest future expansion. Three worked examples for typical food plants:
| Plant Type | Daily Wastewater Volume (m³/day) | Operating Hours (h/day) | Safety Factor | Calculated Capacity (m³/h) | Typical Influent Load (COD mg/L) |
|---|---|---|---|---|---|
| Dairy Processing | 240 | 10 | 1.3 | 31.2 | 3,500 |
| Meat Processing | 160 | 8 | 1.4 | 28.0 | 3,000 |
| Beverage Production | 120 | 12 | 1.2 | 12.0 | 2,000 |
Put a DAF system for FOG removal ahead of the biology in the process flow diagram. It strips FOG and a chunk of organics before they reach the buried reactor, which improves efficiency and extends membrane or biofilm life. Common sizing errors we see in retrofits: ignoring peak FOG loads from cleaning cycles and undercounting the volume those CIP rinses actually generate.
Cost Breakdown and ROI: Underground vs. Above-Ground
Underground systems cost more upfront than basic above-ground basins, but the payback for food plants usually comes from avoided sewer surcharges and recovered land. Cost snapshot by technology:
| System Type | Estimated CapEx ($/m³ capacity) | Estimated Annual OPEX ($/m³ capacity) | Key OPEX Components | Space Savings |
|---|---|---|---|---|
| A/O (Underground) | 150–250 | 5–15 | Energy, minor maintenance | High (60–70%) |
| MBR (Underground) | 300–400 | 15–30 | Energy, membrane cleaning/replacement, chemicals | Very High (70–80%) |
| SBR (Above-Ground) | 100–180 | 8–20 | Energy, maintenance, labor | Low |
Worked example: a food plant discharging 240 m³/day at 30 m³/h over an 8-hour shift installs an underground A/O at $200/m³, roughly $6,000 per m³/h and $180,000 for the 30 m³/h unit. Cutting $80,000 a year in surcharges pays the CapEx back in just over two years. Land above the basin stays productive, which is a real indirect gain on industrial sites. Watch the hidden line items: excavation, specialized installation labor, and permitting delays can each add 10–20% if scheduled late. Surcharge math is unforgiving; a 50 m³/h site running 200 mg/L BOD over its limit can owe more than $100,000 a year, which an appropriately sized underground system erases.
Compliance Strategies for EPA Pretreatment Limits
Consistent compliance with EPA general pretreatment standards (40 CFR Part 403) and local sewer ordinances comes from a documented program, not a single reactor. EPA does not treat food processors as categorical industrial users with federal numerical BOD/TSS limits; local POTWs set those numbers and often levy surcharges on excess strength (EPA Multimedia Environmental Compliance Guide for Food Processors, 1999). City of Amarillo, for example, uses 300 mg/L BOD as the domestic baseline in its industrial surcharge formula. The seven items below cover what food plants should have in writing and in operation:
- Characterize Influent: Run regular lab analysis on COD, BOD, FOG, TSS, pH, and flow to anchor all downstream design decisions.
- Equalize and Neutralize: Use equalization tanks and pH adjustment to smooth shocks from CIP cycles and product changeovers.
- Remove FOG First: Install a DAF system for FOG removal before the biological stage to protect biomass and membranes.
- Match Technology to Load: Pick A/O for moderate strength, MBR for high strength or reuse targets, SBR for variable flow on larger sites.
- Maintain a Sampling Plan: Use 24-hour composite samplers on the discharge line and keep chains of custody for every batch.
- Track Surcharge Triggers: Map local sewer district rate tables and alarm on BOD, TSS, and FOG approaching limit values.
- Document and Audit: Keep an O&M log, train operators on excursion response, and review compliance data monthly with plant management.
According to the EPA Multimedia Environmental Compliance Guide for Food Processors (1999), POTWs commonly require grease-trap maintenance and may surcharge excess BOD and TSS; plants that pair routine monitoring with engineered FOG removal reduce excursion risk versus end-of-pipe biology alone.
Who This Is For and Next Step
This guide fits plant engineers, EPC contractors, and procurement managers sizing packaged underground treatment for dairy, meat, beverage, and snack facilities in the 10–50 m³/h range with COD between 1,500 and 5,000 mg/L. If your stream is below 1,000 mg/L COD with no FOG, a simpler packaged plant may be more cost-effective. If you need discharge under 30 mg/L BOD for direct reuse, plan on MBR with dedicated pretreatment from day one. For a sized proposal on a packaged underground system, send your daily flow, influent COD/BOD/FOG, and discharge limits to request a quote with your design basis.
Frequently Asked Questions
What influent COD can an underground sewage treatment system handle for a food plant?
Underground A/O systems are routinely sized for 1,500–3,000 mg/L COD with 92–97% removal, while underground MBR systems handle 3,000–5,000 mg/L COD at greater than 98% removal. Dairy and snack facilities typically fall in the upper COD range, so MBR is the more common pick above 3,000 mg/L. Match the reactor to measured peak COD, not average COD alone.
How much does it cost to treat a meat processing facility's wastewater underground?
For meat processing at roughly 3,000 mg/L COD and 28 m³/h, expect $150–$250/m³ CapEx for an A/O unit ($180,000–$200,000 total at 30 m³/h) and $5–$15/m³ annual OPEX. Adding FOG pretreatment with a DAF unit raises total CapEx by roughly 15–25% but cuts surcharges and protects downstream biology. Confirm local surcharge rates before locking CapEx.
How is capacity sized for an underground STP in a food processing plant?
Capacity (m³/h) equals daily wastewater volume divided by operating hours, then multiplied by a safety factor of 1.2–1.5. A dairy plant discharging 240 m³/day over 10 hours at a 1.3 factor needs about 31.2 m³/h of treatment capacity, which matches the sizing example in the table above. Always include CIP rinse volume in the daily total.
When should a food plant choose MBR instead of A/O for underground treatment?
Pick MBR when influent COD exceeds 3,000 mg/L, when discharge limits are tight (often under 30 mg/L BOD or TSS), or when the plant wants reuse-quality effluent for cleaning or landscape irrigation. A/O is the lower-cost path when loads sit between 1,500 and 3,000 mg/L COD and standard discharge limits apply. FOG pretreatment remains mandatory for either path.
What pretreatment is required before an underground biological reactor?
Screening, grit removal, pH adjustment, and FOG removal with a DAF unit are the standard four steps ahead of an underground A/O or MBR reactor. Skipping FOG pretreatment is the most common cause of biomass upset and membrane fouling in food-plant retrofits. Size the DAF for peak CIP FOG, not average production FOG.