Why the Cost Gap Between Containerized and Permanent Plants Isn’t Just About CAPEX
Procurement managers often focus on the initial capital expenditure (CAPEX) when comparing containerized and permanent wastewater treatment plants. However, operational expenditure (OPEX), regulatory compliance, and deployment timelines significantly influence the total cost of ownership. Permanent plants, while sometimes appearing more cost-effective upfront, can incur substantial hidden costs, including lengthy permitting processes, which can take 12–24 months in the U.S. and EU, and significant civil engineering work that accounts for 30–50% of the total CAPEX. The operational labor for permanent facilities is typically 2–3 times higher than for their containerized counterparts.
Conversely, containerized systems, despite their rapid deployment (3–6 months vs. 2–5 years for permanent), present their own set of long-term considerations. Modular inefficiencies can lead to 10–20% higher energy consumption. For extended operational periods, containerized plants may require retrofits to meet evolving or stricter long-term compliance standards, such as adding advanced tertiary treatment capabilities. These retrofits can add $50,000–$200,000 to the overall project cost. A real-world case study in Singapore in 2024 demonstrated this trade-off: a containerized plant saved $1.2 million in initial CAPEX but incurred an additional $300,000 per year in OPEX due to issues like membrane fouling, highlighting the importance of considering the full lifecycle cost.
Understanding these nuances is critical for accurate budget forecasting and project planning. The initial CAPEX is only one piece of the puzzle; OPEX, compliance costs, and the time value of money play equally, if not more, important roles in determining the true economic viability of a wastewater treatment solution.
2025 Cost Breakdown: Containerized vs Permanent Plants by Project Type
The following table provides a comparative breakdown of CAPEX, OPEX, and estimated compliance costs for containerized and permanent plants, tailored to different project types. These figures are based on current market data and projected trends for 2025, offering a crucial framework for procurement managers and engineers.
| Project Type | Containerized CAPEX/OPEX | Permanent CAPEX/OPEX | Estimated Compliance Costs |
|---|---|---|---|
| Emergency Response (e.g., spill containment) | $600/m³/day CAPEX; $0.25/m³ OPEX | N/A (Timeline prohibitive) | Minimal (focus on rapid deployment) |
| Temporary Construction Camp (1-3 years) | $700/m³/day CAPEX; $0.22/m³ OPEX | N/A (Timeline prohibitive) | Permitting for temporary structures: $10K–$30K |
| Phased Municipal Expansion (5-10 years) | $900/m³/day CAPEX; $0.20/m³ OPEX | $1,500/m³/day CAPEX; $0.15/m³ OPEX | Containerized: Retrofits $50K–$200K; Permanent: Permitting $100K–$500K |
| Long-Term Industrial (10+ years) | $1,200/m³/day CAPEX; $0.30/m³ OPEX | $2,000/m³/day CAPEX; $0.25/m³ OPEX | Containerized: Retrofits $100K–$300K; Permanent: Permitting $200K–$750K+ |
For projects exceeding five years, OPEX for containerized plants can be 20–40% higher than for permanent solutions due to factors such as higher energy consumption from modular inefficiencies and increased maintenance frequency. Permanent plants, while demanding a larger initial investment and longer construction period, often achieve lower per-unit operational costs over their lifecycle. Compliance costs also vary significantly.
ROI Calculator: When Does a Containerized Plant Pay Off?
Determining the return on investment (ROI) and payback period for wastewater treatment plants is paramount for budgetary control and financial planning. The following table outlines estimated payback periods for containerized and permanent plants across different project durations, assuming key cost variables.
| Scenario | Containerized Payback Period | Permanent Payback Period |
|---|---|---|
| 1-Year Emergency Response | 1.2 years (CAPEX + minimal compliance costs / annual OPEX) | N/A (Not feasible due to timeline) |
| 5-Year Temporary Construction Camp | 3.5 years (CAPEX + permitting / annual OPEX) | N/A (Not feasible due to timeline) |
| 10-Year Phased Municipal Expansion | 8 years (CAPEX + retrofit allowance / annual OPEX savings vs. permanent) | 7 years (CAPEX + permitting / annual OPEX) |
| 20-Year Long-Term Industrial | 15 years (CAPEX + significant retrofit allowance / annual OPEX savings vs. permanent) | 12 years (CAPEX + permitting / annual OPEX) |
The formula used for Payback Period is (Initial CAPEX + Estimated Compliance Costs) / (Annual OPEX Savings + Revenue from Compliance). A 2023 analysis assumes a 5% annual OPEX increase for containerized plants due to the cumulative effects of maintenance and potential component replacements.
Download our interactive ROI Calculator Spreadsheet for custom financial modeling. Link to Gated Asset
Compliance Trade-Offs: Permitting Risks and Retrofit Costs
Navigating environmental regulations is critical in wastewater treatment plant selection. Both containerized and permanent solutions present unique compliance challenges and associated costs that impact project timelines and budgets.
For containerized plants, several compliance risks must be considered. They may face stricter discharge limits, particularly as regulations like the EU's 91/271/EEC mandate up to 95% BOD removal. Achieving these levels often requires retrofits, such as integrating an advanced MBR system for high-efficiency TSS removal, which can add $50,000–$200,000 to CAPEX.
Permanent plants face substantial upfront permitting costs, ranging from $100,000 to over $500,000, depending on the jurisdiction and project complexity. Future-proofing permanent plants for emerging contaminants like PFAS may necessitate substantial upgrades, potentially costing upwards of $1 million.
When evaluating wastewater treatment options, consider regional cost benchmarks, such as those detailed in our Oman 2025 cost breakdown, to factor in local regulatory environments and construction costs.
Decision Tree: Which Plant Type Fits Your Project?
Choosing between a containerized and a permanent wastewater treatment plant requires a systematic approach that considers your project’s specific constraints and objectives. This decision tree guides you through key questions to determine the most suitable solution for your 2025 initiatives.
| Question | Option A | Option B | Option C | Option D | Option E |
|---|---|---|---|---|---|
| 1. Project Timeline: | Less than 1 year (Emergency/Urgent) | 1-5 years (Temporary/Phased) | 5-10 years (Medium-Term Expansion) | Over 10 years (Long-Term) | N/A |
| 2. Budget Priority: | CAPEX Sensitive | OPEX Sensitive | Balanced | N/A | N/A |
| 3. Footprint: | Limited/Restricted | Flexible/Ample | N/A | N/A | N/A |
| 4. Compliance Needs: | Strict (Emerging Contaminants/High Purity) | Moderate (Standard Effluent) | Lenient (Basic Treatment) | N/A | N/A |
| 5. Future Expansion: | High Likelihood | Low Likelihood | N/A | N/A | N/A |
| Recommended Plant Type: | Containerized | Containerized | Containerized or Permanent (Evaluate ROI) | Permanent | Permanent |
| Rationale: | Rapid deployment, lower initial CAPEX. | Flexibility, speed of installation. | Scalability, balance of CAPEX/OPEX. | Lower long-term OPEX, easier long-term upgrades. | Highest long-term efficiency and capacity potential. |
This decision tree assumes no site-specific constraints. For projects prioritizing long-term operational efficiency and lowest OPEX, permanent solutions are typically favored. Understanding MBR technology can also inform decisions.
Frequently Asked Questions
Q: Can containerized plants meet stringent EPA discharge limits?
A: Yes, containerized plants can meet EPA discharge limits, but they may require retrofits. For instance, achieving <30 mg/L BOD limits might necessitate adding an advanced treatment stage like a membrane bioreactor (MBR), adding $50,000–$200,000 to CAPEX.
Q: What is the typical lifespan difference between containerized and permanent wastewater treatment plants?
A: Containerized plants are typically designed for shorter-term use, often with an operational life of 10-15 years before significant refurbishment or replacement. Permanent plants, with proper design and maintenance, can have an operational lifespan of 20-50 years or more.
Q: How do permitting processes differ for containerized versus permanent plants?
A: Permitting for permanent plants is a comprehensive, lengthy process (12-24 months in the U.S./EU) involving detailed site plans and environmental impact assessments.
Q: Are containerized plants more energy-intensive than permanent ones?
A: Generally, yes. Due to modular inefficiencies, containerized plants can consume 10-20% more energy per cubic meter of treated water compared to well-designed permanent facilities.
Q: What are the hidden costs associated with permanent wastewater treatment plants?
A: Key hidden costs include extensive civil engineering (30-50% of CAPEX), prolonged permitting delays, and potential future-proofing costs for emerging contaminants.
Recommended Equipment for This Application
The following Zhongsheng Environmental products are engineered for the wastewater challenges discussed above:
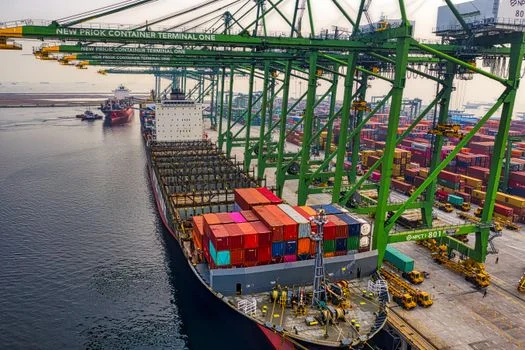
- WSZ Series containerized sewage treatment plant for rapid deployment — view specifications, capacity range, and technical data
Need a customized solution? Request a free quote with your specific flow rate and pollutant parameters.