لماذا تغيّر مياه صرف السيارات الكهربائية في ماريفيل معادلة المقارنة بين MBR وCAS
لمحطات السيارات الكهربائية وقطع الغيار المتجمعة على طول الممر الصناعي بين ماريفيل ومقاطعة بلونت، لا تحكم المقارنة بين المفاعل الحيوي الغشائي (MBR) والحمأة المنشطة التقليدية (CAS) حسابات الكتب المدرسية بقدر ما تحكمها طبيعة الملوثات التي تصل إلى حوض المعادلة. تتقارب أربعة تيارات رئيسية عند نقطة التصريف النموذجية هنا: مياه شطف طلاء الترسيب الكهربائي الإلكتروني (e-coat) ذات الأحمال العالية من الطلب الكيميائي للأكسجين (COD) والمواد الخافضة للتوتر السطحي؛ وفيض مواد الكاثود الذي يحمل آثارًا من النيكل والكوبالت والليثيوم؛ ومستحلبات سوائل التبريد الناتجة عن عمليات التشغيل والمؤلفة من زيت القطع والزيت المعدني والجليكول؛ ومياه الغسيل الهيدروليكي القادمة من مكابس التجميع والتشكيل. يبلغ الطلب الكيميائي للأكسجين (COD) للتيار المدمج عادة بين 500 و5,000 ملغ/لتر، وتتراوح الزيوت والشحوم بين 50 و500 ملغ/لتر بحسب تركيبة الإنتاج اليومية، وتتفاوت النسبة بمقدار رتبة كاملة بين تفريغ خط الطلاء الإلكتروني ومناوبة التشغيل العادية. تقع ماريفيل داخل ممر تينيسي لتصنيع السيارات الكهربائية المرتبط بموردي جنرال موتورز وUltium وشركتي DENSO وDura Automotive، ولذلك فإن واقع التشغيل يتمثل في تصريف تيارات متعددة عالية التركيز من مباني العمليات المتجاورة إلى نظام بيولوجي واحد. السؤالان الحاكمان لأي ترقية في 2026 هما: هل يتوفر في الموقع أرض كافية لحوض CAS، وهل إعادة استخدام المياه كمياه تعويض لأبراج التبريد أو في حلقات الشطف النهائية مجدية اقتصاديًا عند أسعار الكهرباء والمياه الصناعية الحالية في تينيسي.
كيف يعمل كل نظام: نظرة عملية جنبًا إلى جنب
يتكون نظام الحمأة المنشطة التقليدية من حوض تهوية يليه مروّق ثانوي. تكسر الكتل الميكروبية العضوية الذائبة في منطقة التهوية، ويفيض السائل المختلط إلى المروّق، حيث تستقر المواد الصلبة البيولوجية بفعل الجاذبية، وتعيد حلقة الحمأة المنشطة المرتجعة (RAS) الكتلة الحيوية إلى المفاعل. يُحدَّد تركيز المواد الصلبة العالقة في السائل المختلط (MLSS) بسقف يتراوح بين 2,000 و4,000 ملغ/لتر لأن التركيزات الأعلى تُتلف أداء المروّق (S4). أما المفاعل الحيوي الغشائي (MBR) فيستبدل المروّق كليًا بوحدات ترشيح فائق مغمورة من البولي فينيلدين فلوريد (PVDF) بحجم مسام يتراوح بين 0.1 و0.2 ميكرومتر. تبقى المواد الصلبة داخل المفاعل، فيرتفع تركيز MLSS إلى ما بين 8,000 و15,000 ملغ/لتر، ويُسحب الناتج بالشفط أو بالجاذبية عبر الأغشية. ولأن حاجز الغشاء يحجز الكتلة الحيوية فيزيائيًا، يُفصل زمن بقاء الحمأة (SRT) عن زمن المكوث الهيدروليكي، مما يتيح لـ MBR تحليل المركبات العنيدة التي تتسرب عبر المروّق (S2). نمط الفشل الحاسم هو انسداد الأغشية: فالتنظيف الكيميائي ودورات الراحة والتهوية المستمرة للتفريش إلزامية، وهي ما يرفع تكاليف التشغيل (OPEX) وفجوة المهارة المطلوبة لدى المشغلين. تجمع محطة MBR المتكاملة من HydropureWater بين حوض التهوية وكتلة الأغشية في قاعدة حاملة واحدة للتركيب في المواقع القائمة.
مقارنة المعايير: MBR مقابل CAS للأداء الصناعي
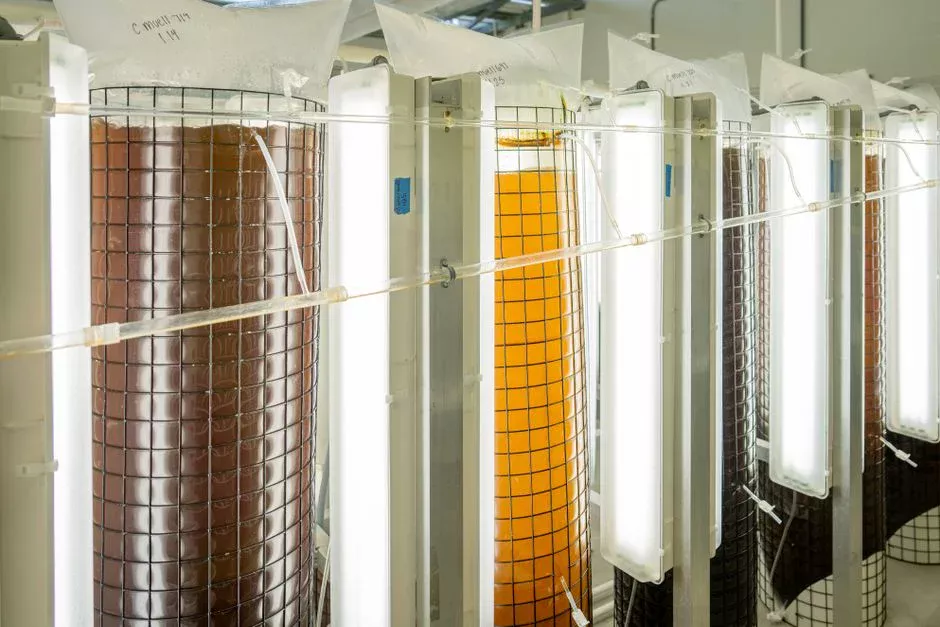
يلخص الجدول التالي المواصفات الفنية ذات الصلة بمراجعة رأس المال في الربع الأول من 2026. تعكس الأرقام نطاقات التشغيل الصناعية النموذجية، لا أدلة التصميم البلدية (S2, S4).
| المعيار | الحمأة المنشطة التقليدية (CAS) | المفاعل الحيوي الغشائي (MBR) |
|---|---|---|
| المواد الصلبة العالقة في السائل المختلط (MLSS) | 2,000–4,000 ملغ/لتر | 8,000–15,000 ملغ/لتر |
| المواد الصلبة العالقة (TSS) في المياه المعالجة | 10–30 ملغ/لتر | قريبة من الصفر (<1 ملغ/لتر) |
| COD/BOD في المياه المعالجة | 40–80 ملغ/لتر COD بدون معالجة ثلاثية | عادةً <30 ملغ/لتر COD |
| إنتاج الحمأة | الخط الأساس | أقل لكل وحدة BOD مُزالة (S2) |
| استهلاك الطاقة | الخط الأساس | +30–50% لكل م³ معالجة (S4) |
| استبدال الأغشية | غير قابل للتطبيق | كل 7–12 سنة (S4) |
| علاوة التكاليف الرأسمالية (CAPEX) | الخط الأساس | +20–50% (S4) |
| علاوة تكاليف التشغيل (OPEX) | الخط الأساس | ارتفاع الطاقة وانخفاض نقل الحمأة |
| انبعاثات غازات الاحتباس الحراري المباشرة | 0.85 كغCO₂مكافئ/م³ | 0.91 كغCO₂مكافئ/م³ (S2) |
| الجسيمات البلاستيكية الدقيقة في المياه المعالجة | ~1 جسيم/لتر | ~0.4 جسيم/لتر (S2) |
| المساحة الأرضية | الخط الأساس | أصغر بنسبة 30–50% (S4) |
في المصانع التي تشغّل المواد المركبة البوليمرية، قد يكفي صف الجسيمات البلاستيكية الدقيقة وحده لتبرير اختيار MBR. أما صف غازات الاحتباس الحراري فمتعادل عمليًا في النمذجة على نطاق المصنع التي أجراها Mannina وآخرون (S2)، وهو ما يهم حين تسأل إدارة المشتريات عن الاستدامة. ولمزيد من التعمق في وحدة الغشاء التي تحرك أرقام MLSS والمياه المعالجة، تُعد وحدات غشاء DF اللوحية من PVDF الوحدة المعتمدة لتغذية مياه الصرف الصناعي المحتوية على الزيوت.
ما الذي يحققه MBR تحديدًا لمحطة سيارات كهربائية
تترجم جدول المعايير إلى أربع نتائج أعمال يمكن لمهندس المصنع الدفاع عنها أمام مراجعة رأس المال. أولًا، يصلح ناتج MBR ليكون تغذية مباشرة للتناضح العكسي (RO) دون الحاجة إلى مرشح رملي أو مرشح متعدد الوسائط منفصل (S4, S6)، مما يلغي وحدة كاملة وتكلفتها التشغيلية من سلسلة إعادة الاستخدام. ثانيًا، يستوعب تركيز MLSS عند 8,000–15,000 ملغ/لتر الأحمال الصدمية الناتجة عن تفريغ خطوط الطلاء الإلكتروني على دفعات وتصريف سوائل التبريد بصورة أفضل بكثير من المروّق، حيث يُعدّ انجراف المواد الصلبة نمط الفشل المعتاد خلال الأحمال المفاجئة. ثالثًا، يخفض خفض المساحة الأرضية بنسبة 30–50% تكلفة كبيرة في ماريفيل حيث تضيق رقع الأراضي الجديدة ولا يمكن توسيع المباني القائمة؛ وغالبًا ما تتسع قاعدة MBR الحاملة داخل هيكل صُمم في الأصل لحوض CAS أصغر. رابعًا، يتيح فصل SRT إزالة أعلى للعضويات العنيدة (S2)، وهو ما يهم المصانع التي تسعى لميزانيات مياه قريبة من التفريغ الصفري (ZLD) أو التي تُصرّف إلى مياه استقبال حساسة في إطار خطة تينيسي لإعادة استخدام المياه لعام 2022. وبند جودة إعادة الاستخدام هو البند الذي يقلب موازين القرار الاقتصادي في العادة.
المعالجة الأولية غير قابلة للتفاوض: حماية الغشاء
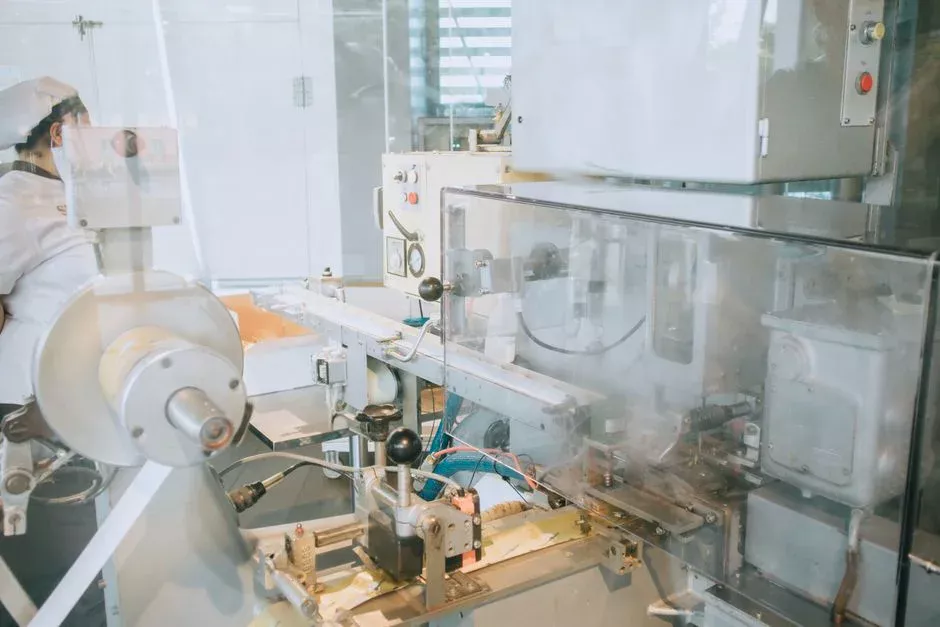
لا يكون أداء MBR أفضل إلا بقدر جودة ما لا يصل إليه من زيوت وشحوم. أما بالنسبة للتيارات الخارجة من خط الطلاء الإلكتروني أو خلية التشغيل أو محطة الغسيل الهيدروليكي في ماريفيل، فيجب أن يسبق MBR جهاز التعويم بالهواء المذاب (DAF) أو فاصل الزيوت عن المياه، وإلا فإن الشحوم والدهون تُغطّي سطح الغشاء خلال أيام (S4). المراحل الأخرى المطلوبة في المنبع تشمل معادلة الرقم الهيدروجيني (pH)، والتصفية الخشنة (1–2 مم عادةً)، وحوض معادلة بحجم يكفي لتسطيح التذبذبات اليومية بين مناوبات الإنتاج (S4, S6). وسلسلة الفشل ميكانيكية ويمكن التنبؤ بها: انتقال الشحوم والدهون ← تكوّن طبقة كيك على الغشاء ← ارتفاع ضغط الغشاء ← تضاعف وتيرة التنظيف الكيميائي ← انخفاض عمر الغشاء دون 7 سنوات ← تكاليف رأسمالية غير مخططة. تُعد وحدة التعويم بالهواء المذاب المعالجة الأولية المعيارية لإزالة الشحوم والدهون في هذا القطاع. ويتناول دليل مقارنة المعالجة الأولية لمياه صرف السيارات الكهربائية في Surgoinsville القريبة سلسلة الانسداد ذاتها ببيانات واقعية.
واقع التكلفة في 2026 لماريفيل: CAPEX وOPEX ورصيد إعادة الاستخدام
احسب ميزانية المشروع على صورة فارق عن خط الأساس لـ CAS، لا كعرض سعر مستقل لـ MBR. ترتفع التكاليف الرأسمالية (CAPEX) بنسبة 20–50% لصالح MBR، وتهيمن عليها وحدات الأغشية والمراوح المُصممة لتهوية التفريش وحزمة القياس الأكثر انضباطًا (S4). وترتفع تكاليف التشغيل (OPEX) بنسبة 30–50% من حيث الطاقة لكل م³ معالجة (S4)، يقابلها جزئيًا خفض تكاليف نقل الحمأة المنشطة الزائدة لأن MBR ينتج حمأة أقل لكل كيلوغرام من BOD المُزالة (S2). ويُعدّ استبدال الأغشية بند استهلاك يُرحَّل كل 7–12 سنة (S4)، وعادةً ما تُمذجه الإدارات المالية كمساهمة في صندوق إهلاك. البند الذي يقلب القرار في ماريفيل هو رصيد إعادة الاستخدام: المصنع الذي يستبدل نحو 30,000 م³/سنة من مياه المدينة بأسعار تينيسي الصناعية يسترد عادةً علاوة CAPEX لـ MBR خلال 5–7 سنوات. وتتأثر الحسابات بتعريفة المياه الصناعية المحلية ونسبة الناتج التي يمكن توجيهها إلى مياه تعويض أبراج التبريد مقارنة بالشطف النهائي. ويُكمّل دليل المقارنة بين MBR وCAS من حيث المساحة الأرضية لتيارات BOD العالي والشحوم والدهون هذا القسم.
| بند التكلفة | خط أساس CAS | فارق MBR | تعليق |
|---|---|---|---|
| CAPEX المعدات | 1.0× | +20–50% | وحدات الأغشية والمراوح والقياس (S4) |
| الأعمال المدنية والمساحة الأرضية | 1.0× | −30–50% | بدون مروّق ثانوي وحوض أصغر (S4) |
| الطاقة (لكل م³) | 1.0× | +30–50% | تهوية التفريش ومتطلبات الأكسجين لـ MLSS الأعلى (S4) |
| نقل الحمأة | 1.0× | أقل | انخفاض إنتاج الحمأة المنشطة الزائدة (S2) |
| استبدال الأغشية | غير قابل للتطبيق | كل 7–12 سنة | تُرحَّل كصندوق إهلاك (S4) |
| رصيد إعادة الاستخدام | 0 | خاص بالموقع | يحقق استردادًا خلال 5–7 سنوات عند استبدال نحو 30,000 م³/سنة من مياه المدينة |
| البوليمر (PAM/PAC) | الخط الأساس | أقل غالبًا | انظر دليل تحسين تكلفة جرع PAC وPAM لعام 2026 |
يُعدّ تجفيف الحمأة المنشطة الزائدة خارج المفاعل الحيوي بندًا يستحق التسعير؛ فمكبس ترشيح صفائحي بحجم مناسب يخفض حجم الكيك وتكلفة النقل، مما يُحسّن مباشرة جانب OPEX في قضية MBR. كما أن اختيار البوليمر مهم، ويوفر دليل تحسين تكلفة جرع PAC وPAM لعام 2026 المرجع لضبط هذا البند.
إطار القرار: متى يُختار MBR ومتى يبقى CAS هو الأنسب
اختاروا MBR حين تكون رقعة الأرض الجديدة ضيقة، وحين تكون إعادة استخدام المياه أولوية استراتيجية في 2026 ضمن إطار تينيسي لإعادة استخدام المياه، وحين تدفع حدود تصريف TDEC NPDES الصناعي قيمة المواد الصلبة العالقة (TSS) في المياه المعالجة إلى ما دون 20 ملغ/لتر، أو حين تتضمن التغذية مركبات عنيدة لا يحتجزها المروّق (S2, S4). ولمعظم مصانع السيارات الكهربائية في ماريفيل، يتحقق شرط واحد على الأقل من هذه الشروط الأربعة. وأبقوا على CAS، أو CAS مع مرحلة ترشيح فائق ثلاثية، حين تكون الأرض رخيصة، وكان تصريح التصريف بمستوى بلدي تقليدي، وافتقر فريق التشغيل إلى التدريب على عمليات الأغشية. كما يعدّ التعديل الهجين خيارًا قابلًا للتطبيق: الإبقاء على حوض CAS القائم لخفض BOD/COD وإضافة مرحلة UF أو MBR ثلاثية فقط لخطوة اللمعان، ثم تغذية التناضح العكسي (RO). ويُعدّ هذا المسار المرحلي في الغالب الأرخص للوصول إلى جودة إعادة الاستخدام دون إلغاء التكلفة المدنية المستثمرة، ويمكن تركيب محطة MBR المتكاملة من HydropureWater أسفل حوض التهوية القائم بأعمال مدنية طفيفة. وأيًا كان المسار الذي تختارونه، تبقى قائمة المراجعة لعام 2026 واحدة: التأكد من مظلة تصريح TDEC، والتأكد من المعالجة الأولية (DAF والتصفية والمعادلة)، والتأكد من مستلِم إعادة الاستخدام، وتسعير صندوق إهلاك استبدال الأغشية قبل توقيع أمر الشراء.
الأسئلة الشائعة
هل يُبرَّر استخدام MBR لمحطة سيارات كهربائية في ماريفيل عام 2026؟
نعم، حين يكون الموقع ذا مساحة أرضية محدودة، ويستهدف إعادة استخدام المياه في أبراج التبريد أو حلقات الشطف، ويتيح تركيب جهاز DAF قبل الأغشية. وفي هذه الظروف تُسترد علاوة CAPEX البالغة 20–50% عادةً خلال 5–7 سنوات من رصيد إعادة الاستخدام وتكلفة الأعمال المدنية المتجنبة (S4).
كم تزداد الطاقة وCAPEX في MBR مقارنة بـ CAS؟
ترتفع الطاقة بنسبة 30–50% لكل م³ معالجة بسبب تهوية التفريش ومتطلبات الأكسجين لـ MLSS الأعلى، وترتفع CAPEX بنسبة 20–50% بفعل وحدات الأغشية والمراوح الأكبر في المقام الأول (S4).
ما المعالجة الأولية التي يحتاجها MBR لمياه صرف السيارات الكهربائية الزيتية؟
يُعدّ وجود جهاز DAF أو فاصل زيوت عن مياه قبل MBR إلزاميًا، إضافة إلى معادلة pH والتصفية الخشنة وحوض معادلة. وبدون إزالة الشحوم والدهون، يهبط عمر الأغشية دون الحد الأدنى البالغ 7 سنوات وتتضاعف وتيرة التنظيف الكيميائي (S4).
كم مرة يجب استبدال أغشية MBR؟
خطِّطوا للاستبدال كل 7–12 سنة باعتباره بند استهلاك ضمن صندوق إهلاك؛ وهذه الفترة هي العمر النموذجي لوحدات PVDF المغمورة على التغذية الصناعية (S4).